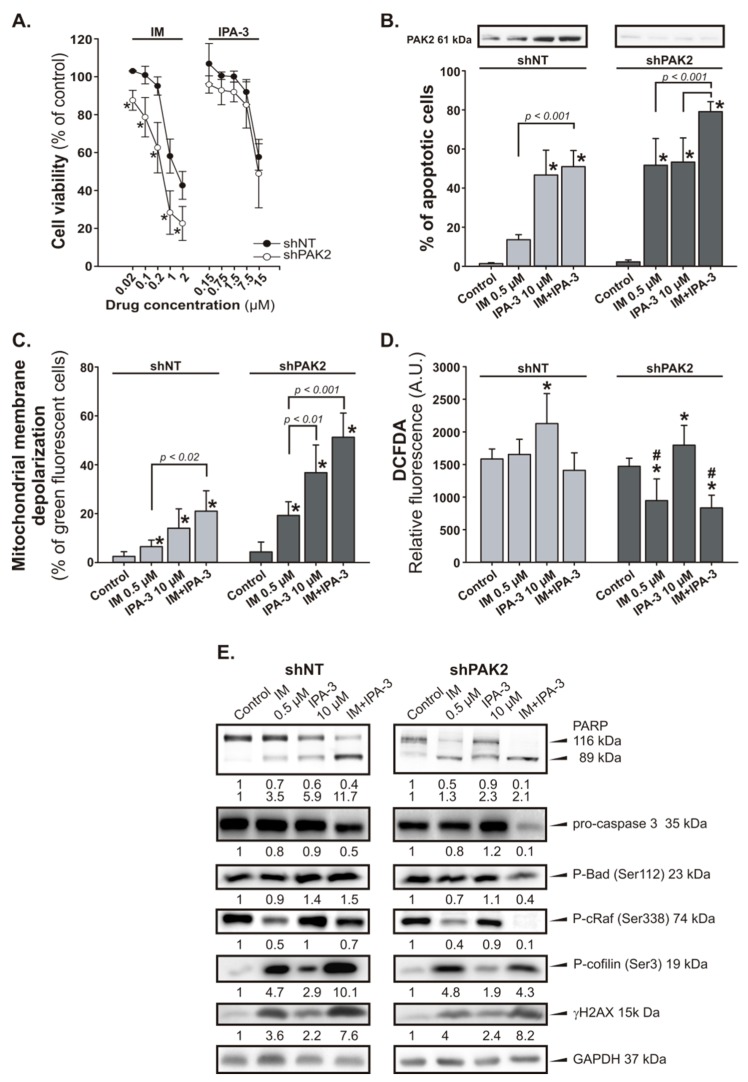
Figure 4.
Effect of the combination of IM and IPA-3 on p21-activated protein kinase (PAK)2-silenced 32DclBCR-ABL1 cells (shPAK2). shPAK2 cells and control (shNT) cells were treated with IM and/or IPA-3 for 24 h as indicated. (A) Cell viability was determined using the MTT assay. Each point represents mean ± SD (n ≥ 5), * p < 0.05 in comparison to untreated cells. (B) Apoptosis detection. Data are expressed as the mean annexin V-FITC/PI staining ± SD (n = 5). * p < 0.001 in comparison to control (C). PAK2 expression level in shNT and shPAK2 cells was determined by Western blot analysis. (C) Changes in the mitochondrial membrane potential. Green fluorescence of monomeric form of JC-1 was detected, indicating dissipation of ΔΨm. Mean ± SD (n = 4), * p < 0.05 value in comparison to (C). (D) Intracellular levels of reactive oxygen species (ROS) in shPAK2 cells. Data are represented as the mean DCFDA staining ± SD, * p ≤ 0.03 when compared to (C), # p < 0.05 when compared to the corresponding shNT cells. (E) Western blot of the indicated proteins; GAPDH was used as a loading control. The changes in the protein levels were estimated by quantification of band intensities with the QuantiScan ver.3.0 (Biosoft, UK) densitometry analysis software.

