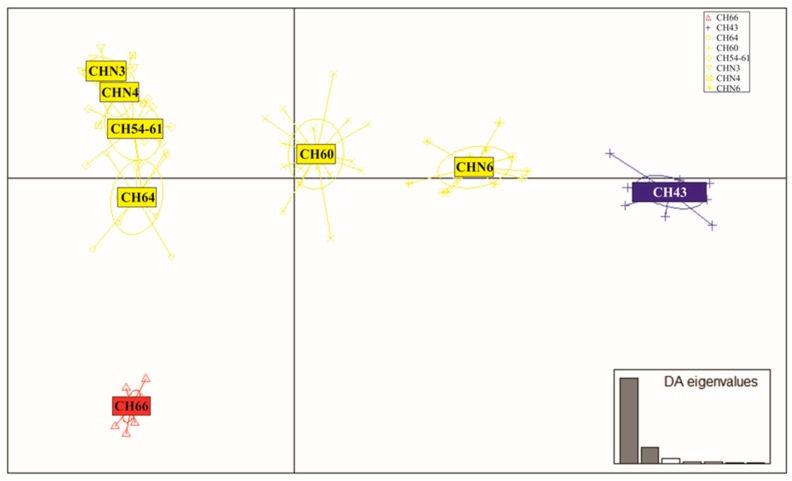
Figure 2.
Discriminant analysis of principal components (DAPC) scatter plots [36] based on 103 SNP loci for eight populations of the parental species A. charrua and A. reicherti and putative hybrid ponds. Populations are shown by colours: A. charrua (red), A. reicherti (blue), hybrid populations (yellow) and 95% inertia ellipses, squares represent individual genotypes. Axes show the first two discriminant functions, and eigenvalues the genetic information retained by discriminant functions.

