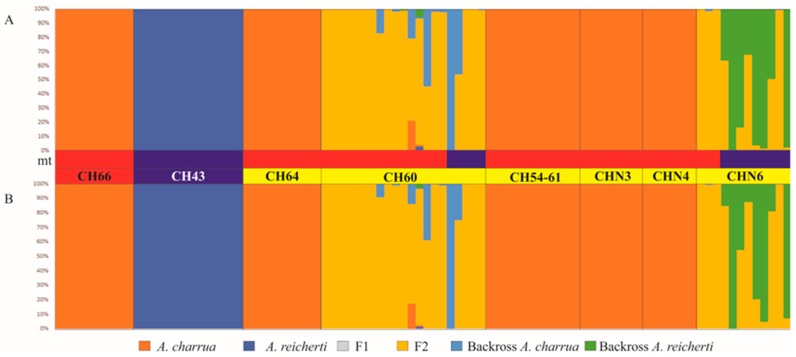
Figure 4.
Posterior probabilities of the ancestral genotype class estimated with NewHybrids. (A) Uniform prior assumption. (B) Jeffrey prior assumption. Each individual is represented as a vertical bar divided into six segments. Each color indicates the posterior probability of an individual assignment to pure A. reicherti (blue), pure A. charrua (red), F1 (grey), F2 (yelow), and first generation backcross of a F1 hybrid with a pure A. reicherti (BC1R, green) or with a pure A. charrua (BC1C, sky). Populations are labeled above the bar plots. mt bars: represent the Cytb haplotype assignation of each individual to A. charrua (red) or A. reicherti (blue) species.

