Figure 1.
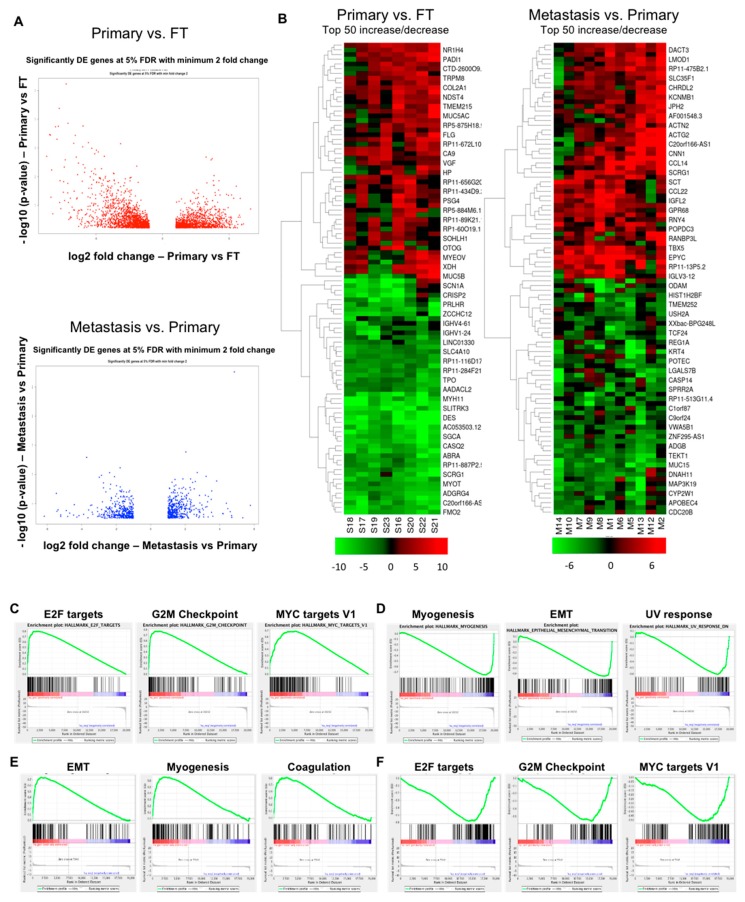
Gene expression analysis of ovarian carcinogenesis and progression. (A) Top: Volcano plot representing differentially expressed (DE) genes for primary tumors versus fallopian tube. Bottom: Volcano plot representing differentially expressed genes for metastasis versus primary tumors. The -log10 (p-values) plotted against log2 fold change values for all the significantly differentially expressed genes at 5% false discovery rate (FDR) with at least a two-fold change between Primary versus fallopian tube tumors (FT) (top) and Metastasis versus Primary tumors (bottom). The dots on the negative and positive values of X-axis in the top figure represent downregulated and upregulated genes, respectively, in Primary tumors relative to FT. The bottom figure represents the same in metastatic tumors relative to primary tumors. (B) Heat map representing top 50 upregulated and downregulated genes (fold change, at least 5% FDR) in primary tumors versus fallopian tube (Left) and in metastasis versus primary tumors (Right). Elevated gene expressions are depicted by increasingly deeper shades of red, while the diminished levels of expression are indicated by deeper shades of green. (C) Gene set enrichment analysis (GSEA) in primary tumors versus fallopian tube (positively correlated). (D) Primary tumors versus fallopian tube (negatively correlated). (E) GSEA in metastasis versus primary tumors (positively correlated). (F) Metastasis versus primary tumors (negatively correlated).

