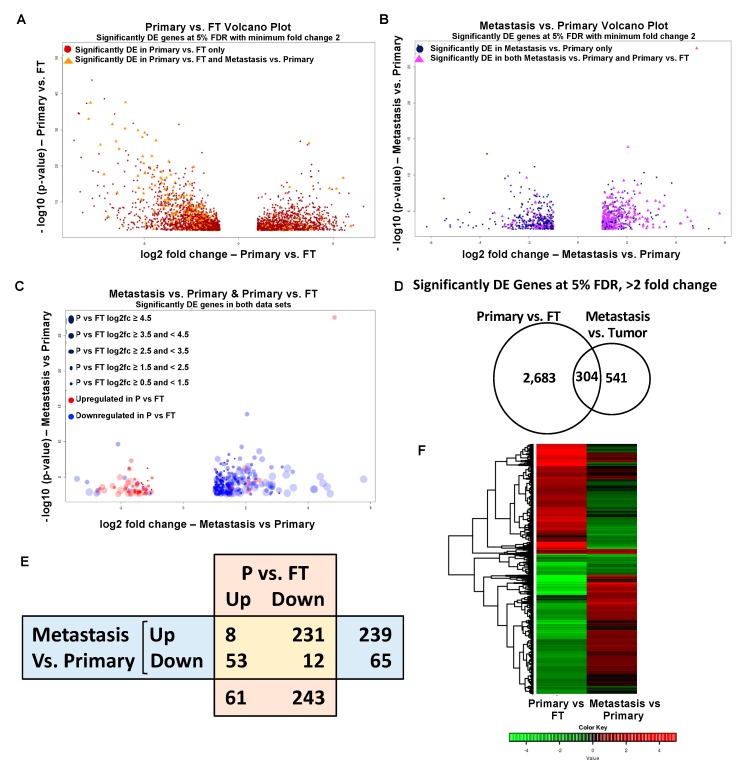
Figure 4.
Gene expression analysis in ovarian cancer. (A) Volcano plot representing differentially expressed (DE) genes for primary tumors versus fallopian tube (red dots), where the differentially expressed genes common to both primary tumors versus fallopian tube and metastasis versus primary tumors are highlighted (orange triangles). The −log10 (p-values) plotted against log2 fold change values for all the significantly differentially expressed genes at 5% FDR with at least two-fold change between primary tumors versus FT (B) Volcano plot representing differentially expressed genes for metastasis versus primary tumors (blue dots), where the differentially expressed genes common to both primary tumors versus fallopian tube and metastasis versus primary tumors are highlighted (purple triangles). The −log10 (p-values) plotted against log2 fold change values for all the significantly differentially expressed genes at 5% FDR with at least two-fold change between metastasis versus primary tumors. (C) Volcano plot for metastasis versus primary tumors showing only the differentially expressed genes common in both metastasis versus primary tumors and primary tumors versus fallopian tube. Circle size is correlated to the fold change in expression in primary tumors versus fallopian tube. Circles are color coded to depict upregulation (red) or downregulation (blue) in primary tumors versus fallopian tube. (D) Venn diagram representing the overlap between primary tumors versus fallopian tube and metastasis versus primary tumors. (E) Table representing common upregulated and downregulated genes in ovarian cancer metastasis versus primary tumors and primary tumors (P) versus FT. (F) Combined heat map showing the hierarchical clustering based on log2 fold change values of common significantly differentially expressed genes in primary tumors versus fallopian tube and metastasis versus primary tumors.

