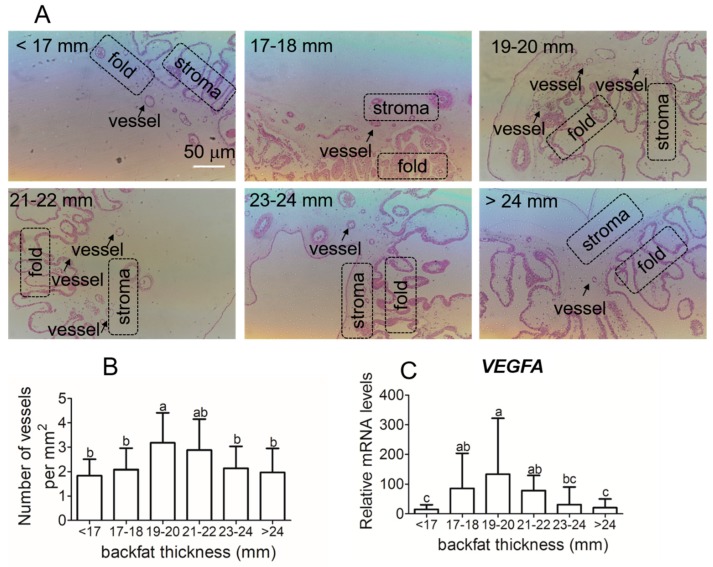
Figure 4.
Average numbers of capillary per mm2 placenta tissues and vascular endothelial growth factor (VEGF)A mRNA expressions in placenta tissue of different backfat thickness sows. (A) placenta tissue slices. (B) to quantify villous capillary density. (C) VEGFA mRNA expressions. Each group had 10–12 sows, and 4–5 placenta samples were analyzed per sow, mean ± SEM. Different letter showed significant difference (p < 0.05). The arrows indicate the placental vessels in stroma (200× magnification).

