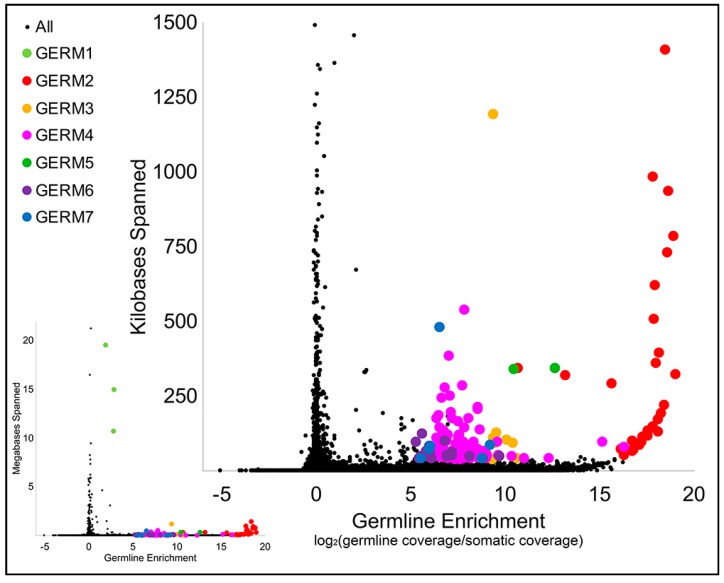
Figure 2.
Estimates of the total genomic span and germline enrichment of repetitive sequences in the lamprey genome. The plot on the lower left shows enrichment values for the entire collection of reconstructed repetitive elements, including Germ1. The larger plot on the upper right focuses on repeats that span <1.5 megabases. Sequences belonging to repeat classes selected for hybridization are highlighted by colors corresponding to their repeat class.

