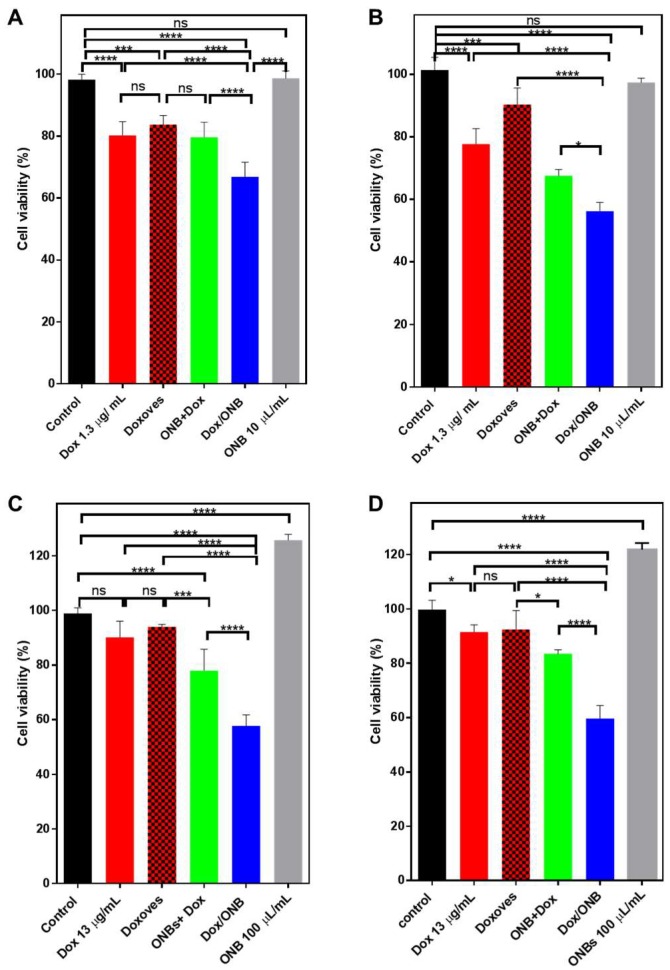
Figure 6.
Cell viability and Dox efficiency measured in normal conditions and hypoxic conditions. Cell viability measured through trypan blue staining, control normalized at 100%. (A) Normal condition MDA-MB-231 cell line. (B) Normal conditions HeLa cell line (C) Cell viability in hypoxic conditions for MDA-MB-231 cells (D) Cell viability in hypoxic conditions for HeLa cells. * indicates p-value < 0.05, *** indicates p-value < 0.001, **** indicates p-value < 0.0001 ns indicates no significant difference. Statistical analysis was done by using one-way ANOVA followed by post hoc analysis of Tukey’s multiple comparisons test.

