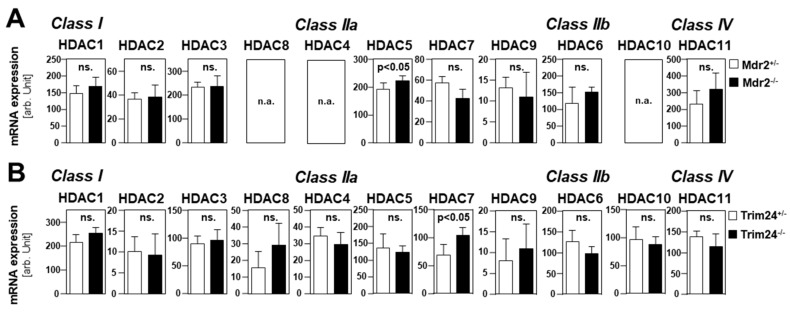
Figure 3.
HDAC expression levels in genetically induced murine HCC models. (A,B) In silico analysis of mRNA expression levels for different HDACs was performed using GEO/GSE datasets (https://www.ncbi.nlm.nih.gov/geoprofiles). (A) RNA expression levels in pre-cancerous stages in the murine Mdr2 knockout HCC model in heterozygous ((Mdr+/-, n = 6) and homozygous (Mdr-/-, n = 6) knockouts (*p < 0.05 vs hetero). (B) RNA expression levels in livers from wild-type (ctrl, n = 5) as compared to HCC tumors (HCC, n = 5) derived from the Trim24-deficient spontaneous murine HCC model (ns: non-significant vs ctrl; *p < 0.05 vs ctrl).

