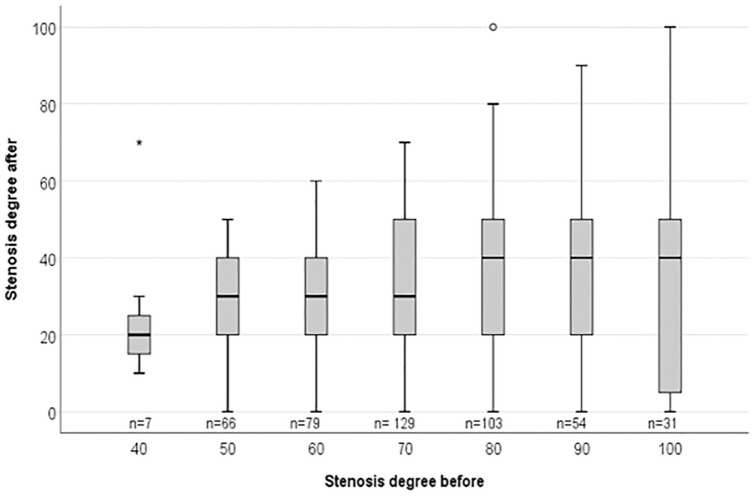
Figure 1.
Results of 469 PTAs displayed by box plot and the median value of the remaining stenoses. The x-axis shows the degree of stenosis (%) before intervention and the y-axis the degree of stenosis after PTA. The number of PTAs are given below the boxes (n=). The Spearman correlation of the median residual stenosis and the primary stenosis (r = 0.93, p = 0.003) indicates a greater residual stenosis after PTA in those with a more extensive primary stenosis.

