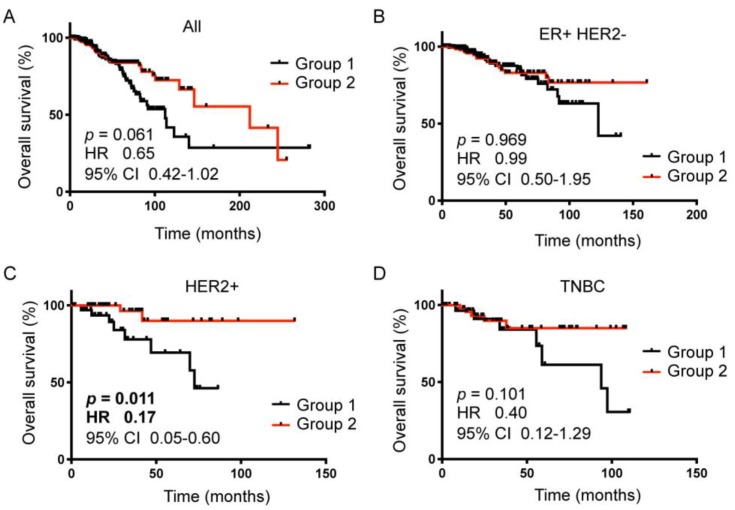
Figure 4.
Kaplan-Meier survival analyses of the TCGA breast cancer patient data using PAGES-HBC Group 1 vs Group 2 compositions. (A), All breast cancer patients, (B), ER+ HER2− breast cancer patients, (C), HER2+ breast cancer patients, (D), Triple-negative breast cancer patients. Black line, Group 1 patients; red line, Group 2 patients; Kaplan-Meier analysis was done using Prism Graphad software; p values and hazard ratios were determined using Log-rank (Mantel-Cox) test.

