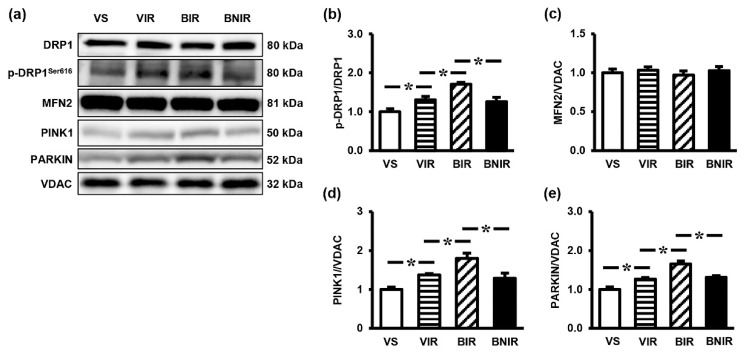
Figure 5.
Representative images of western blots (a) and the quantitative analyses of p-DRP1/DRP1 (b), MFN2 (c), PINK1 (d), and PARKIN (e) in the liver following renal ischemia-reperfusion (RIR) in rats with bisphenol A (BPA) exposure and N-acetylcysteine (NAC) treatment. Values are means ± SEM (n = 6). VS: vehicle-treated sham group; VIR: vehicle-treated RIR group; BIR: BPA (50 mg/kg)-treated RIR group; BNIR: BPA (50 mg/kg) plus NAC (100 mg/kg)-treated RIR group. * p < 0.05 between groups.

