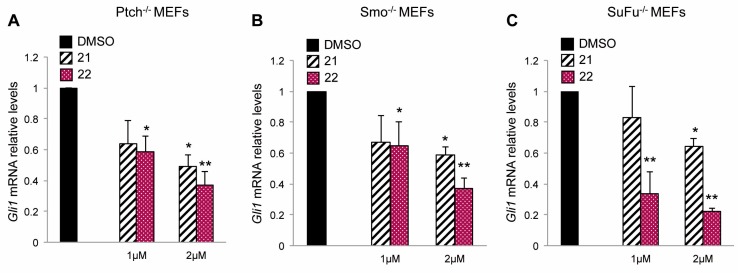
Figure 3.
Inhibitory effect of compounds 21 and 22 on Hh-active cell models. The graphs show mRNA expression levels of Gli1 in Ptch1−/− (A), Smo −/− (B) and SuFu−/− (C) MEFs treated for 48 h with DMSO as a control, or compounds 21 or 22 at 1 or 2 μM concentrations. Gli1 mRNA levels were normalized to endogenous controls β2-microglobulin and Hprt. Data show the mean ± SD of three independent experiments. (*) p < 0.05 vs. DMSO; (**) p < 0.01 vs. DMSO.

