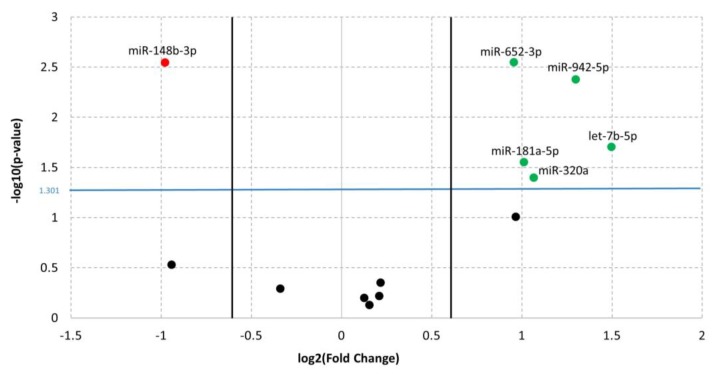
Figure 2.
Volcano plot of qPCR data referring to the comparison of miRNAs expressions between ADHD and TDs. The Y-axis values show the negative logarithm base 10 (log10) of the p-values; the blue horizontal line on the plot represents the threshold p-value used for this analysis (0.05). The values in the X-axis indicate the log2 differences in estimated relative expression of the miRNAs of interest; the vertical lines represent the thresholds for the log2 fold change (equivalent to a fold change of 1.5). Thus, the red dot corresponds to downregulated miRNA, whereas the green dots correspond to upregulated miRNAs.

