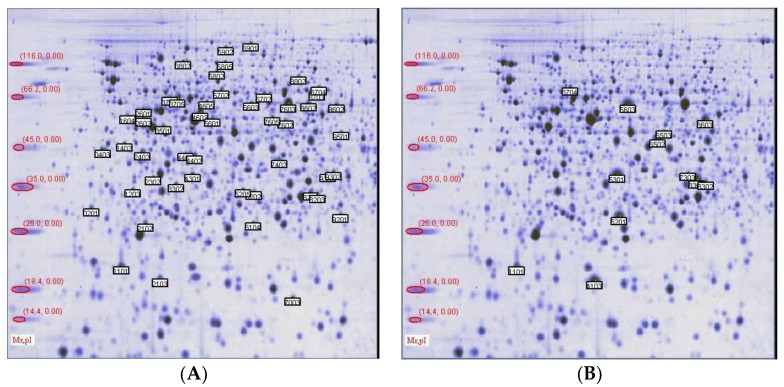
Figure 2.
Two-dimension gel electrophoresis of proteins from liver extract stained with Coomassie Brilliant Blue. pH 3−10 nonlinear first dimension, and 12% SDS–PAGE second dimension. (A) shows that there were 73 differential spots in the drug-treated group compared with model group; (B) shows that there were 22 differential spots in the drug-treated group compared with control group. Differentially expressed proteins are marked in each spot sustained an individual identification number (SSP).

