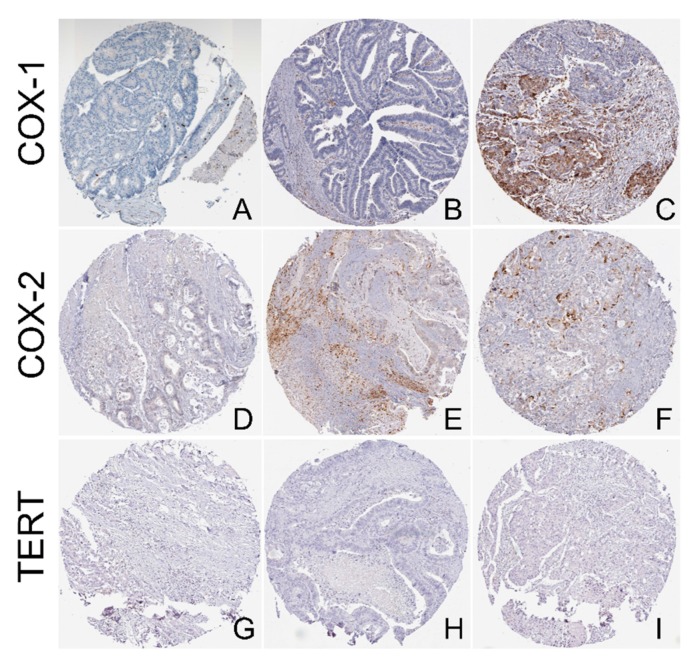
Figure 3.
Representative tissue microarray (TMA) slides with COX-1, COX-2, and TERT-staining. (A) Negative COX-1 staining was detected in 4/10 (40%) CRC samples; (B) Low COX-1 staining was detected in 5/10 (50%) CRC samples; (C) Medium intensity COX-1 staining was detected in 1/10 (10%) CRC samples; (D) Negative COX-2 staining was detected in 7/12 CRC samples (58.3%); (E) Low COX-2 staining was detected in 4/12 CRC samples (33%); (F) Medium COX-2 staining was detected in 1/12 (8.3%) CRC samples; TERT staining was negative in all CRC samples (11/11, 100%) (G–I). All slides were retrieved from the Human Protein Atlas (HPA). Magnification, ×100.

