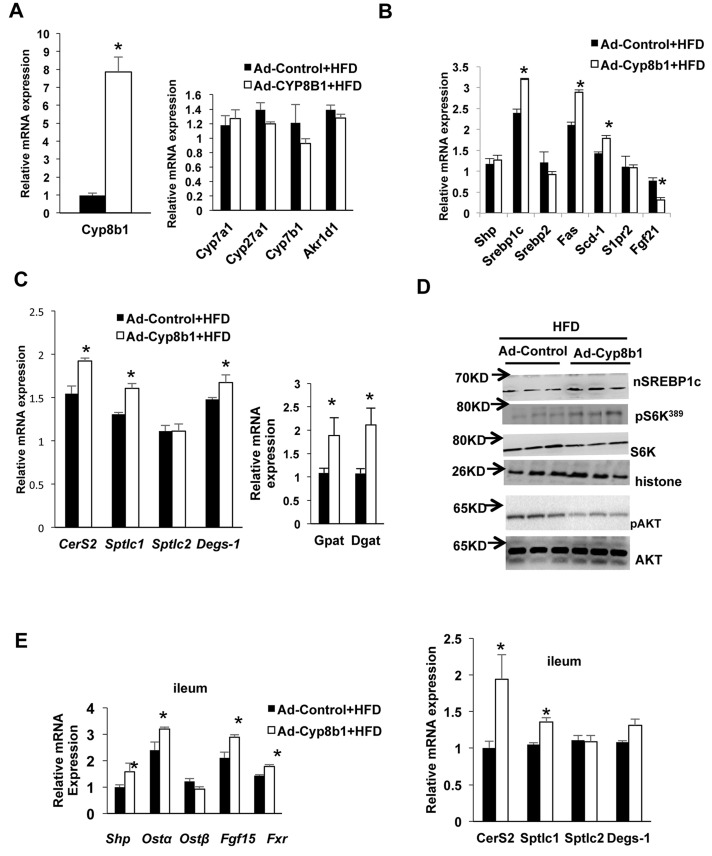
Figure 4.
Effect of Ad-Cyp8b1 on lipid and lipoprotein metabolism in high-fat diet (HFD)-fed mice. Wild-type C57BL/6J mice were injected with Ad-CYP8B1 (n = 11) or Ad-Control (n = 11; indicated by an arrow). Mice were fed a high-fat diet (60% calorie from fat) for 2 weeks. Mice were fasted for 6 h before sacrifice. (A) Body and food intake of HFD-fed mice injected with Ad-CYP8B1 compared to Ad-Control HFD-fed mice. (B) Insulin tolerance test (ITT) and glucose tolerance test (GTT) of HFD-fed mice injected with Ad-Cyp8b1 compared to Ad-control HFD-fed mice. ITT was performed on the 11th day after adenovirus injection (left), and GTT was performed on the 13th day after adenovirus injection. (C) Liver triglyceride (TG); serum cholesterol and triglyceride; and serum AST and ALT. (D) Serum FGF21 protein levels. (E) H&E staining of lipids in livers of chow-fed and HFD-fed mice injected with Ad-Cyp8b1 or Ad-Control virus (representative image from one liver in each group). Representative images are shown. (F) FPLC analysis of serum cholesterol and triglyceride. Sera were pooled from five Ad-Cyp8b1 and five Ad-Control mice for analysis. Serum cholesterol (top) and serum triglycerides (bottom) were assayed in each FPLC fractions: VLDL (Nos. 10–14), LDL (Nos. 18–22), and HDL (Nos. 22–28). (G) Serum ceramides in Ad-Cyp8b1. (H) VLDL secretion assay. Results are shown as means ± SE. Student’s t-test was used for statistical analysis. *Statistically significant difference (p < 0.05), Ad-Cyp8b1 versus Ad-Control mice.

