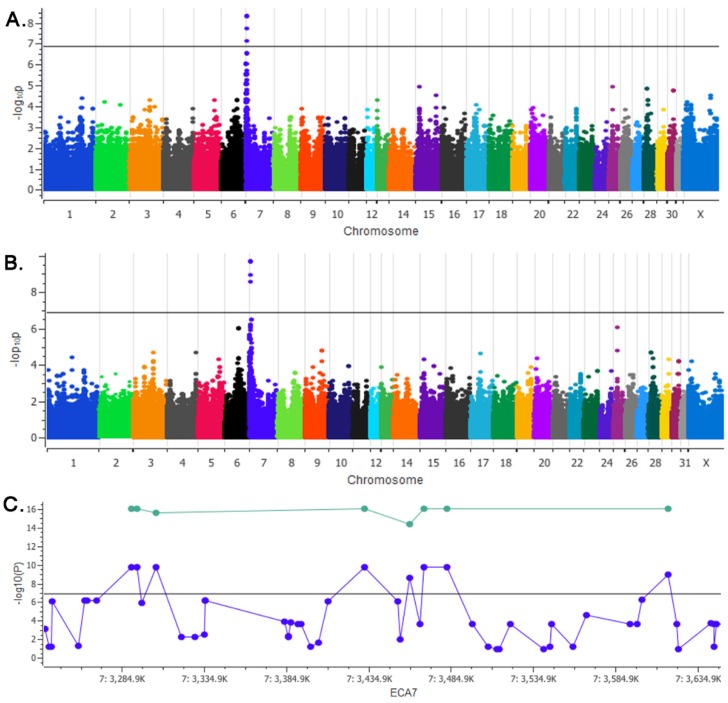
Figure 2.
A genome wide association study (GWAS) identifies the locus for mushroom phenotype in Shetland Ponies. (A) Manhattan Plot for the χ2 basic allelic association test. (B) Single locus mixed linear model (SLMM) utilizing an F-test to calculate p-values. (A,B) Plotted on the y-axis are the -log 10P values calculated for each test against the chromosomes plotted on the x-axis. The horizontal black line across each plot represents Bonferroni significance (P < 1.4 × 10⁻⁷). (C) A 326 kb region on ECA7 reaching genome wide significance. Plotted in blue are the data points from the SLMM GWAS analysis (N = 24). Plotted in green are the eight SNPs from this region genotyped in our replication sample set, displaying the combined p-values under a recessive model for the GWAS and replication sample sets (N = 40 mushroom ponies, N = 29 chestnut).

