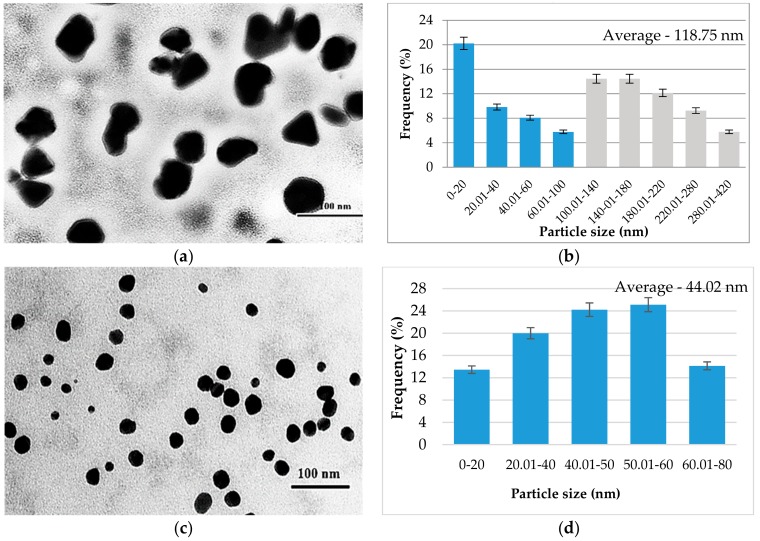
Figure 5.
Graphical representation of AgNPs synthesized in the presence of the extract obtained from the beech bark and AgC2H3O2: (a) TS3— TEM photomicrograph; (b) histogram of the distribution of AgNP size distribution in TS3; (c) TS4—TEM image; (d) histogram of the distribution of AgNP size distribution in TS4. (TS3—beech bark extract, pH = 4, AgC2H3O2; TS4—beech bark extract, pH = 9, AgC2H3O2).

