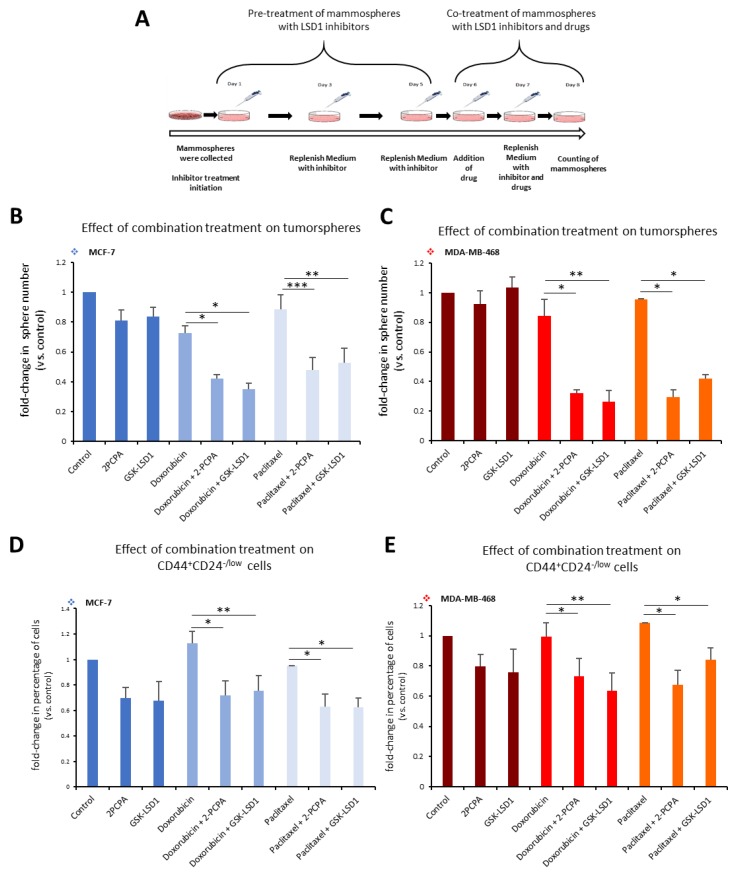
Figure 6.
Combination treatment of breast tumorspheres with LSD1 inhibitors targets all cancer cells. (A) Schematic representation of combination treatment of tumorspheres with LSD1 inhibitors and an anti-cancer drug. MCF-7- and MDA-MB-468-derived tumorspheres were treated with 2-PCPA (50 μΜ) or GSK-LSD1 (2 μΜ) for 5 days. On the sixth day, doxorubicin (2.5 μΜ) or paclitaxel (15 μΜ) were added for two more days. On the last day of treatment, the number of tumorspheres was counted. (B) Graphical representation of the effects of combination treatment on MCF-7 tumorspheres. The dark blue panel depicts vehicle-treated, 2-PCPA- or GSK-LSD1-treated tumorspheres. The light blue panel depicts doxorubicin-treated tumorspheres, alone or in combination with an LSD1 inhibitor. The grey blue panel depicts paclitaxel-treated tumorspheres, alone or in combination with an LSD1 inhibitor. (C) Graphical representation of the effects of combination treatment on MDA-MB-468 tumorspheres. The dark red panel depicts vehicle-treated, 2-PCPA- or GSK-LSD1-treated tumorspheres. The red panel depicts doxorubicin-treated tumorspheres, alone or in combination with an LSD1 inhibitor. The orange panel depicts paclitaxel-treated tumorspheres, alone or in combination with an LSD1 inhibitor. (D) Graphical representation of FACS analysis data for the CD44+CD24-/low CSC subpopulation in MCF-7 tumorspheres. Colors depict the same conditions described in (B). (E) Graphical representation of FACS analysis data for the CD44+CD24-/low CSC subpopulation in MDA-MB-468 tumorspheres. Colors depict the same conditions described in (C). Error bars represent SEM. * p < 0.05, ** p < 0.01, *** p < 0.001.

