Figure 1.
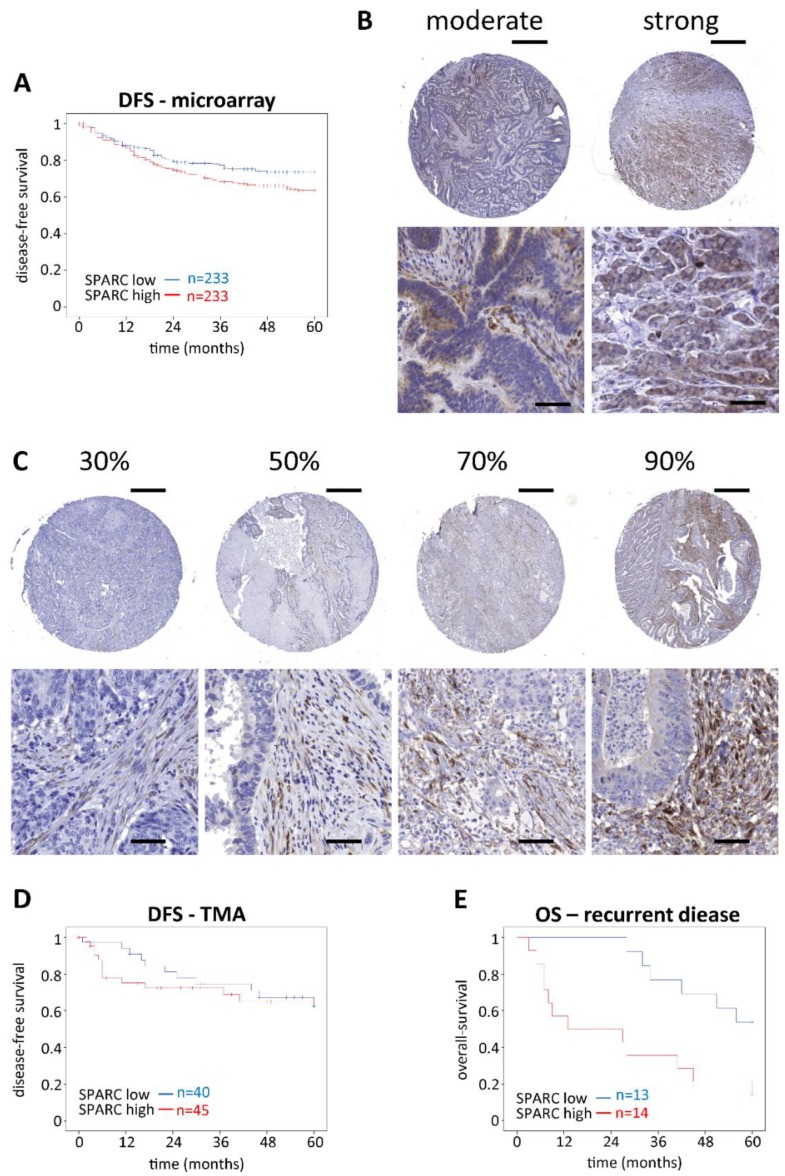
Impact of SPARC expression/abundance on OS and DFS. (A) Kaplan-Meier curves were plotted by choosing the cutoff at the median SPARC mRNA expression (microarray, n = 466). Patients with high SPARC expression had a decreased 5-year DFS (p = 0.048). (B,C) Tissue microarray slides were stained with monoclonal anti-SPARC antibodies, scanned as described in materials and methods, and scored for positively stained cells in epithelium and stroma separately. The panels show representative examples for positive epithelium (B) and different levels of SPARC-positive stroma (C). Scale bars for the overview pictures (upper right corner) represent 500 µm. Scale bars for the zoomed images represent 50 µm. (D,E) For Kaplan-Meier analysis, the cut-off was again set at the median of positive stromal SPARC %. Stromal SPARC abundance did not affect 5-year DFS (D) (n = 85). Patients with disease recurrence (n = 27) had a reduced OS when their primary tumors were highly positive for stromal SPARC (E) (p = 0.007). All statistical analyses were performed by using Log Rank tests. OS, overall-survival. DFS, disease-free survival. TMA, tissue microarray.

