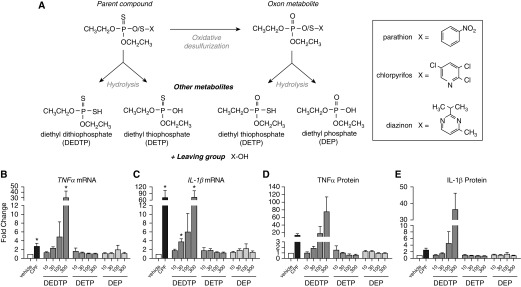
Figure 2.
Influence of phosphorothioate versus phosphate OP metabolites on TNF-α and IL-1β mRNA expression and protein release in THP1 cells. Differentiated THP1 cells were treated with 100 μM chlorpyrifos (CPF) or the OP metabolites O,O-diethyl dithiophosphate (DEDTP; 10–300 μM), O,O-diethyl thiophosphate potassium salt (DETP; 10–300 μM), or diethyl phosphate (DEP; 10–300 μM) for 24 hours. (A) Schematic of OP metabolism. X is the chemical structure that specifically identifies each OP. (B–E) Effects of CPF versus OP metabolites on (B and C) TNF-α and IL-1β mRNA and (D and E) protein levels in THP1 cells and conditioned media, respectively. The effect on cytokine expression was expressed as a fold change over expression in vehicle controls (0.1% DMSO) in each experiment. Data are presented as the mean ± SEM (each exposure was performed in triplicate wells; n = 4 separate experiments). *Significantly different from vehicle control at P ≤0.05.

