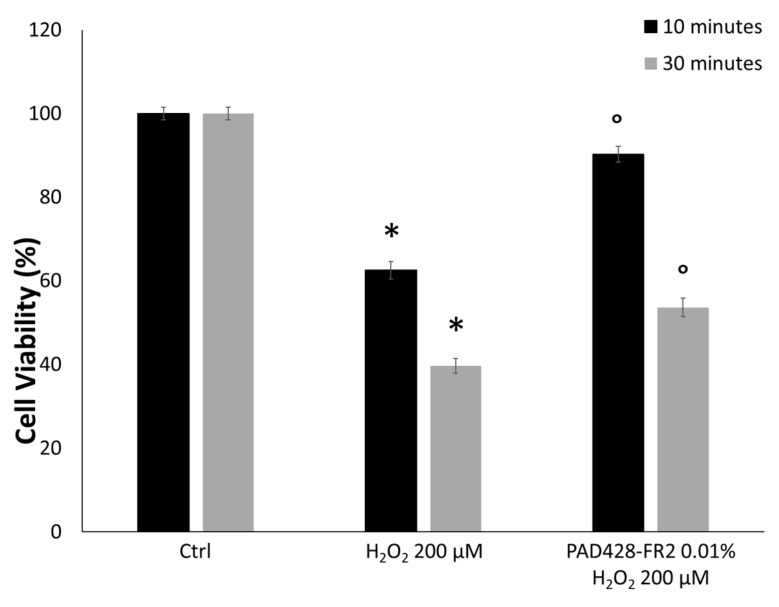
Figure 7.
MTT assay performed on SIRC cells pretreated with PAD428-FR2 0.01% for 24 h and then stimulated with H2O2 (200 µM) for 10 and 30 min. Untreated cells were used as negative control; cells treated with H2O2 (200 µM) were used as a positive control. The results are expressed as the percentage of cell viability with respect to untreated control cells (Ctrl). Values are mean ± SD of three experiments in triplicate. * p < 0.05 vs. control group; ° p < 0.05 vs. H2O2-treated cells.

