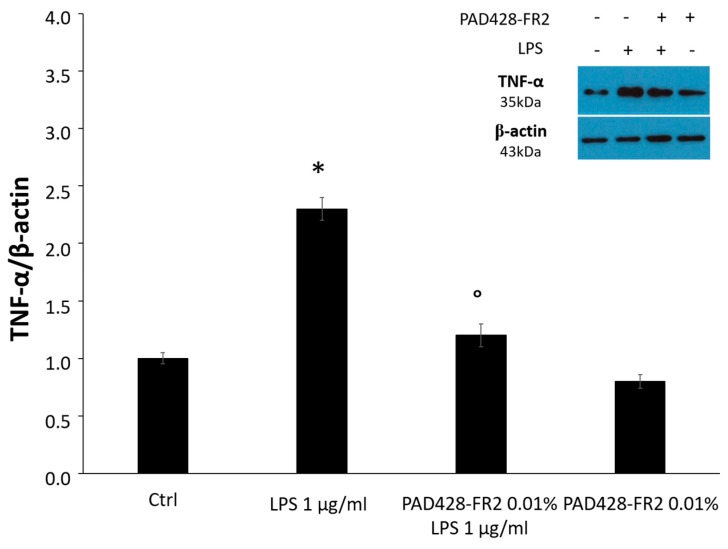
Figure 11.
TNF-α levels evaluated by Western Blot analysis performed on SIRC cells pretreated with PAD428-FR2 0.01% for 2 h and then stimulated with LPS (1 μg/mL) for 24 h. Untreated cells were used as a negative control; cells treated with LPS (1 μg/mL) were used as a positive control. β-actin was used as the loading control. Values are mean ± SD of three experiments in triplicate. * p < 0.05 vs. control group; ° p < 0.05 vs. LPS-treated cells.

