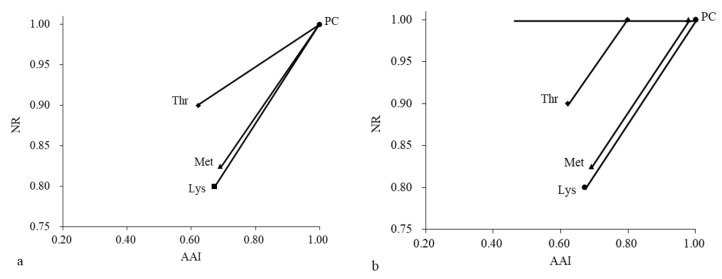
Figure 3.
The pattern diagram (b) when Met and Thr are converted to an equivalent slope (a) with Lys. The y-axis represents the ratio of NR after deleting Lys, Met, Thr to that of the PC treatment; the x-axis is the ratio of the amino acid intake (AAI) in the amino acid deleting treatments to that in the PC treatment. (Lys, ■) = Lys intake and NR level in PD–Lys treatment, (Met, ▲) = Met intake and NR level in PD–Met treatment, (Thr, ◆) = Met intake and NR level in PD–Thr treatment, and (PC, ●) = Lys, Met, Thr intake and NR level in PC treatment; all values =1.

