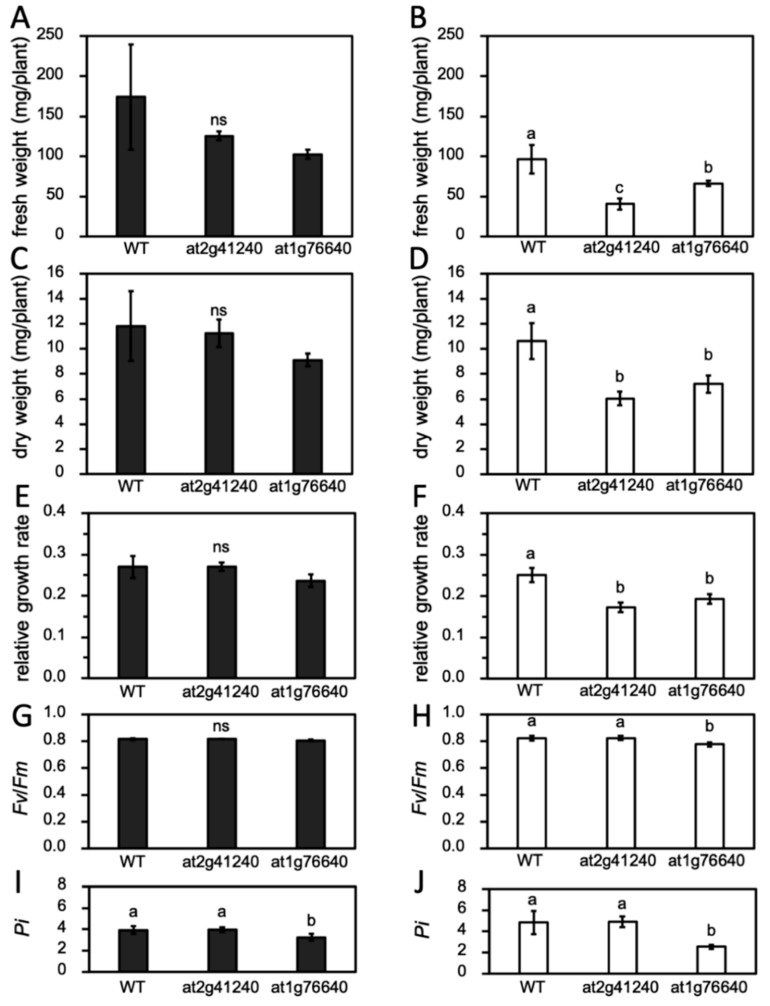
Figure 9.
Phenotype of the Arabidopsis wild type (WT) and mutant under normal and salt stress conditions (250 mM NaCl) at 7 days after treatment in saline soil. Fresh weight (A,B), dry weight (C,D), relative growth rate (E,F), PSII maximum efficiency (Fv/Fm) (G,H), and performance index (Pi) (I,J) of Arabidopsis WT, at2g41240, and at1g76640 mutants under normal (represented with black bars) and 250 mM NaCl salt stress condition (represented with white bars). Different letters represent significant differences between groups (p < 0.05) and ns means no significant difference among means. Vertical bars represent standard deviation.

