Figure 5.
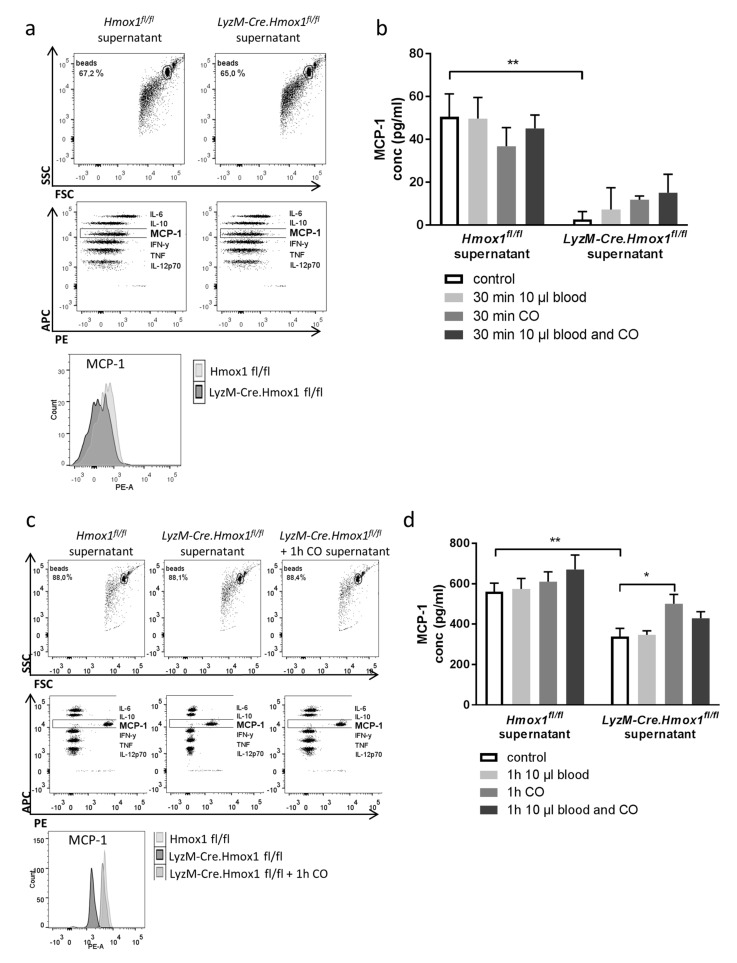
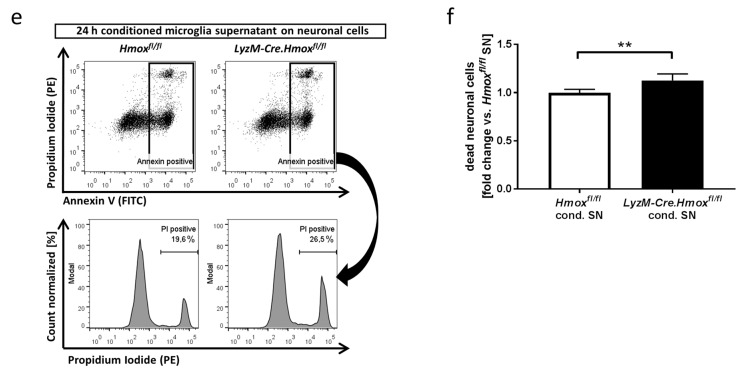
HO-1 dependent shift in microglial cytokine release after blood exposure. (a) Representative flow cytometry plots analyzing the cytokine secretion by Hmox1 fl/fl or LyzM-Cre.Hmox1 fl/fl microglia after 30 min of blood and CO exposure, Cytometric Bead Array (CBA) Mouse Inflammation Kit with IL-6, IL-10, MCP-1, IFN-γ, TNF, and IL-12p70 (b) Flow cytometric determination of microglial MCP-1 secretion by Hmox1 fl/fl or LyzM-Cre.Hmox1fl/fl microglia +/− blood and CO 250 ppm, 30 min. ** p = 0.009 for control Hmox1 fl/fl vs. LyzM-Cre.Hmox1 fl/fl, n = 3 experiments. (c) Representative flow cytometry plots analyzing the cytokine secretion by Hmox1 fl/fl or LyzM-Cre.Hmox1 fl/fl microglia after 1 h of blood and CO exposure. (d) Flow cytometry of microglial MCP-1 secretion in Hmox1 fl/fl or LyzM-Cre.Hmox1 fl/fl microglia +/− blood and CO 250 ppm, 1 h. ** p = 0.001 for control Hmox1 fl/fl vs. LyzM-Cre.Hmox1 fl/fl, * p = 0.05 LyzM-Cre.Hmox1 fl/fl control vs. CO, n = 3 experiments. (e,f) Effect of factors released by microglia on neuronal cell death in HT22 cells in vitro analyzed by flow cytometry after annexin V/PI staining. HT22 cells were exposed to 10 µL blood and cultivated for 24 h in 50% supernatant of cultured microglia isolated from either Hmox fl/fl or LyzM-Cre.Hmox fl/fl mice and conditioned with 10 µL blood exposure for 1 h. ((e) representative flow cytometry plots (cond = conditioned; SN = supernatant; PI = propidium iodide; propidium iodide (PI) was detected in the PE channel and annexin V in the FITC channel); (f) quantification as fold change vs. Hmox fl/fl from total of n = 6 experiments; dead neuronal cells = annexin V and PI-positive cells; ** p = 0.0026).


