Figure 7.
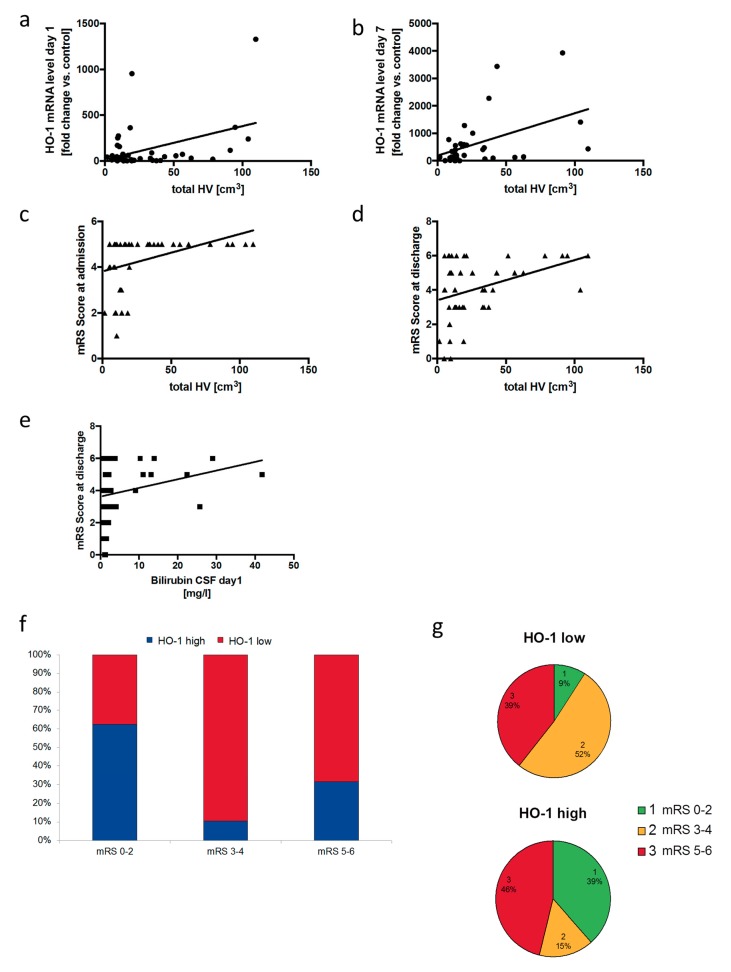
Correlation of HO-1 in the CSF of SAH patients with neurological outcome. (a,b) Correlation of HO-1 mRNA level in cells of the CSF from patients with SAH on day 1 after hemorrhage (a) and day 7 (b) with the total hematoma volume observed on the initial CT scan (Spearman correlation, r = 0.17, p = 0.3 for day 1; r = 0.42, p = 0.02 for day 7). (c,d) Correlation of the modified Rankin Scale (mRS) score from patients with SAH on admission (c) and discharge (d) with the total hematoma volume observed on the initial CT scan (Spearman correlation, r = 0.47, p = 0.001 for admission mRS; r = 0.32, p = 0.03 for discharge mRS). (e) Correlation of the mRS score at discharge from patients with SAH with bilirubin content in the CSF on day 1 after hemorrhage (Spearman correlation, r = 0.28, p = 0.04). (f,g) Frequencies of relative HO-1 mRNA level categories (HO-1 low vs. HO-1 high) within the observed mRS score groups in SAH patients at discharge (f) and distribution of the observed mRS score categories within the relative HO-1 mRNA level groups (g) in SAH patients at discharge (x2 test for sampling distribution (df = degrees of freedom); both x2(2) = 7.677, p = 0.02).

