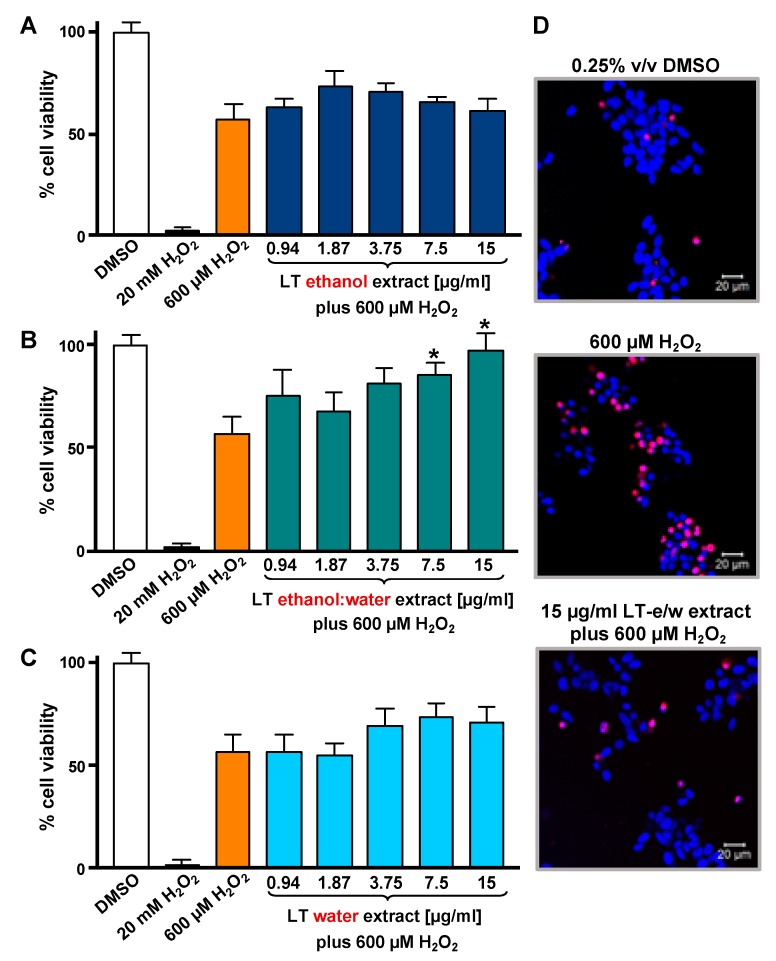
Figure 2.
LT extracts prepared with three different solvents were tested on SH-SY5Y cells under H2O2-induced oxidative stress. The DNS assay and a bioimager system were used. Cells were exposed for 12 h to both a single H2O2 concentration (600 µM) and a concentration gradient (0.94 to 15 µg/mL) of the LT extracts in different solvents: (A) Ethanol, (B) ethanol:water (e/w) mixture, and (C) water. Controls included cells treated with DMSO (0.25% v/v) and 20 mM of H2O2 as positive for cytotoxicity. The asterisk (*) indicates a significant difference between cells treated with both LT-e/w extract and H2O2 (600 µM), as compared with cells treated just 600 µM H2O2 control (p < 0.05). Each bar shows the average of three biological replicates with its corresponding standard deviation. (D) Representative images of SH-SY5Y cells stained with Hoechst (blue) and PI (red) used to quantify levels of cytotoxicity: Vehicle control (DMSO); positive control for cytotoxicity, 600 µM H2O2; and cotreatment with both LT-e/w extract and 600 µM H2O2. Cells emitting just blue signal were considered healthy/alive, whereas cells emitting magenta color, as a result of colocalization of the blue and red fluorescence signal, were considered dead cells.

