Figure 3.
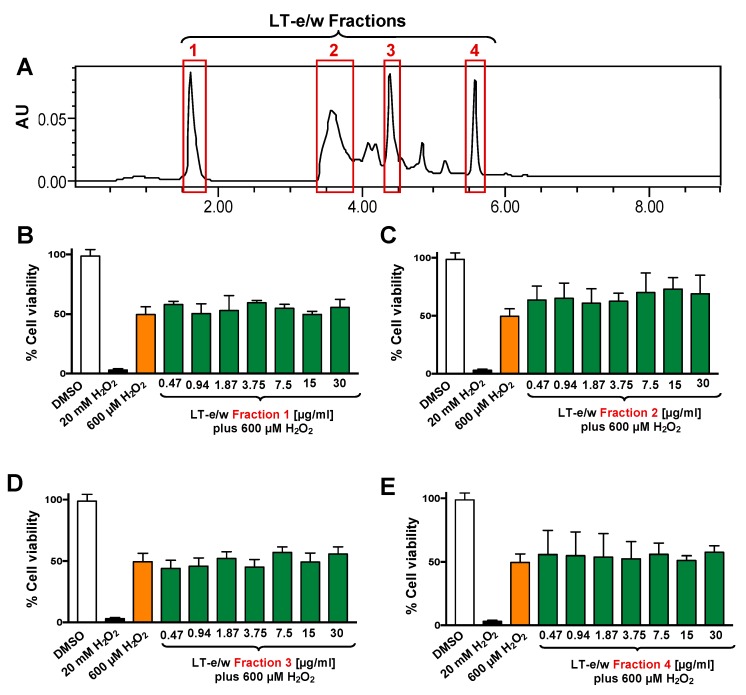
Four LT-e/w fractions were collected and individually tested on SH-SY5Y cells under H2O2-induced oxidative stress. (A) Chromatogram obtained from the whole LT-e/w extract, where the red rectangular boxes specify the choices for all the four fractions. The four most prominent peaks were individually collected and named from 1 to 4. Cells were exposed for 12 h to both a single H2O2 concentration (600 µM) and a concentration gradient (0.47 to 30 µg/mL) of each individual LT-e/w fraction: (B) Fraction 1, (C) Fraction 2, (D) Fraction 3, and (E) Fraction 4. The following controls were included in this series of experiments: Cells treated with DMSO (0.25% v/v) as solvent control, and cells exposed to 20 mM of H2O2 as a positive control for cytotoxicity. Each bar shows the average of three biological experiments with its corresponding standard deviation.

