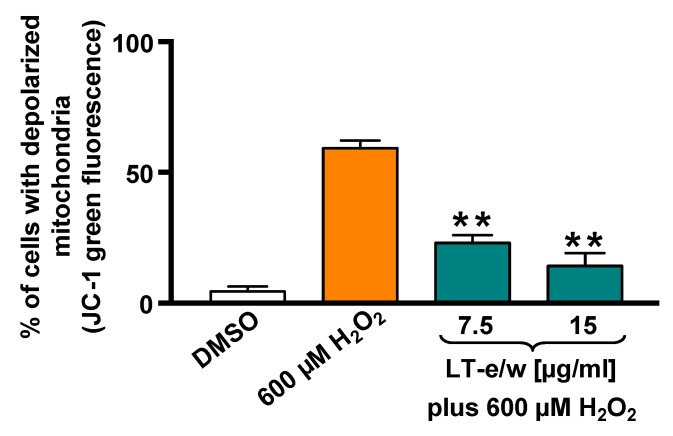
Figure 4.
LT-e/w extract decreased the H2O2-induced mitochondrial depolarization significantly on SH-SY5Y cells in a concentration-dependent mode. Mitochondrial membrane potential (ΔΨm) changes were measured by the JC-1 staining profile via flow cytometer. DMSO 0.25% v/v was included as a control. As a positive control for cytotoxicity, 600 µM of H2O2-treated cells were also included. The y-axis displays the percentage of cells with depolarized mitochondria emitting the JC-1 green fluorescence signal. The significant difference between 600 µM H2O2-treated cells, as compared with cells simultaneously treated with both LT-e/w extract plus 600 µM H2O2, was of p < 0.01 (**). Each bar indicates the average of three biological replicates with its corresponding standard deviation.

