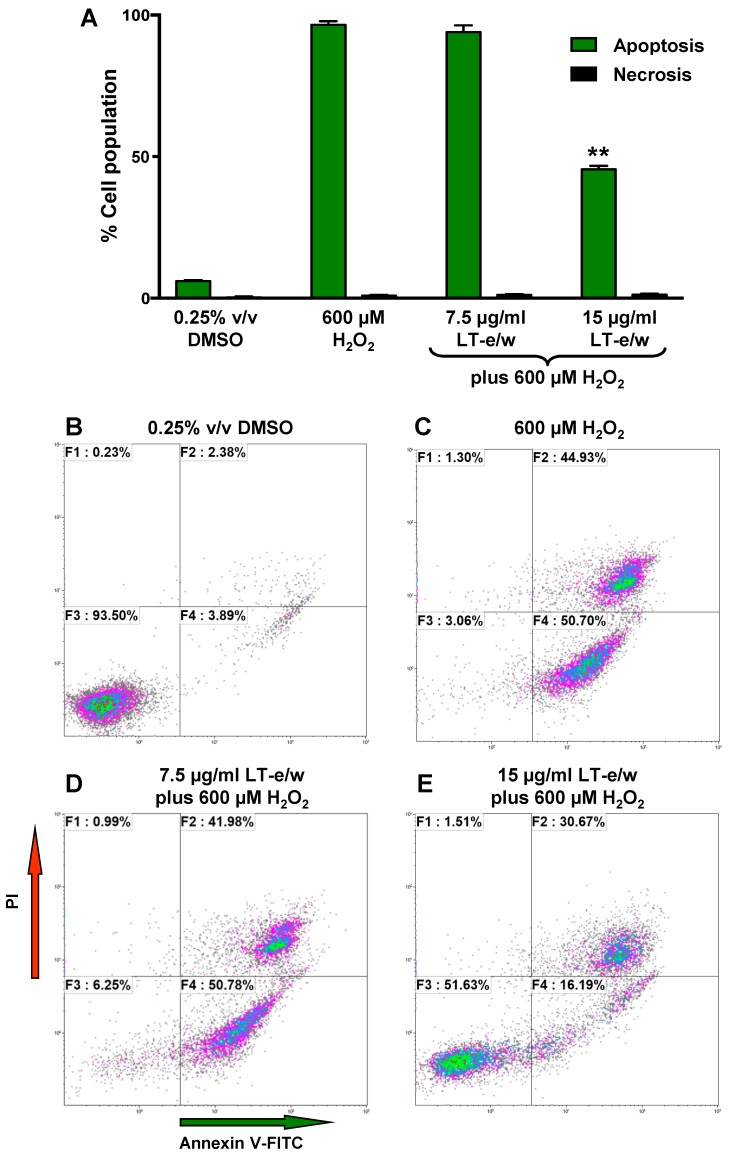
Figure 6.
LT-e/w extract reduced the H2O2-induced apoptosis significantly in SH-SY5Y cells in a dose-dependent manner. (A) After the cells were concurrently exposed to LT-e/w extract (7.5 or 15 µg/mL) and 600 μM H2O2, the annexin V-FITC, and propidium iodide (PI) staining profile was reviewed via flow cytometer (Gallios, Beckman Coulter). Each bar specifies the average of three biological replicates with its corresponding standard deviation. The asterisk (**) indicates a significant difference between cells exposed to both 15 µg/mL LT-e/w extract and 600 µM H2O2, as compared with cells treated with just 600 µM H2O2 (p < 0.01). B to E) Representative flow cytometric dot plots used to quantify the apoptosis and necrosis percentages depicted in panel A. (B–E) Analysis from each quadrant in the dot plots were defined as follows: The bottom left quadrant denotes unstained viable cells, annexin V-FITC, and PI negative; the top left quadrant specifies necrotic cells that are just PI-positive; the top right quadrant comprises late apoptotic cells that are both annexin V-FITC- and PI-positive; and the right bottom quadrant indicates early apoptotic cells that are just positive for annexin V-FITC. The Kaluza flow cytometry software (Beckman Coulter) was used for acquisition and analysis of data.

