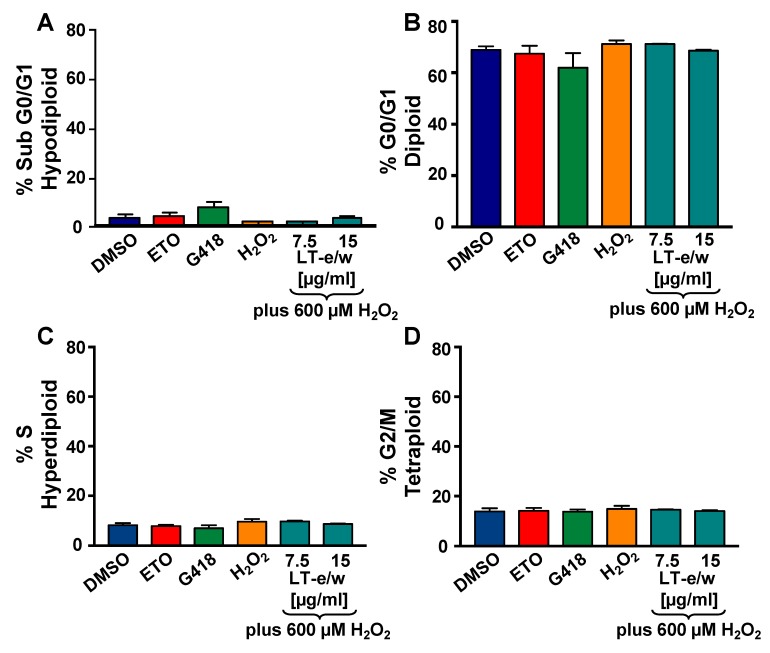
Figure 9.
LT-e/w extract did not modify the cell cycle distribution profile or the DNA fragmentation subpopulation in SH-SY5Y cells under oxidative stress. Cells were fixed, permeabilized, and 4′,6-diamidino-2-phenylindole (DAPI)-stained and analyzed via Gallios flow cytometer. (A–D) The events (cells) frequency are plotted along with the y-axis, whereas the varied treatments are included along with the horizontal x-axis. Controls for this series of experiments included: Cells treated with the solvent control (DMSO), 200 nM etoposide (ETO), 1 mg/mL G418, and 600 µM H2O2. Each bar represents an average of triplicate and the error bars represent their corresponding standard deviation. For data acquisition and analysis purposes, the Kaluza flow cytometry software was utilized (Beckman Coulter).

