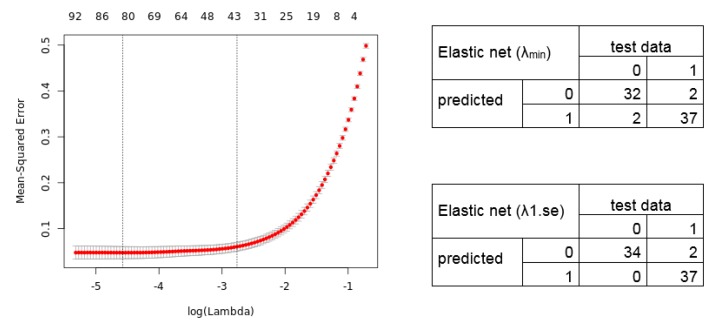
Figure 4.
Elastic net regression model. (Left) The plot displays the 10-fold cross-validation errors and the upper and lower standard deviation along to the lambda values of the Elastic net regression model. The vertical dotted lines represent the two selected lambdas. The lambda.min value (left line) minimizes the prediction error (MSE), whereas lambda.1se (right line) gives the most regularized model (most simple model within one standard deviation of the optimal model). Values above the plot show the number of variables included in the model. (Right) Confusion matrix depicting the diagnostic potential of the signatures validated on the test dataset (0 = healthy, 1 = tumor).

