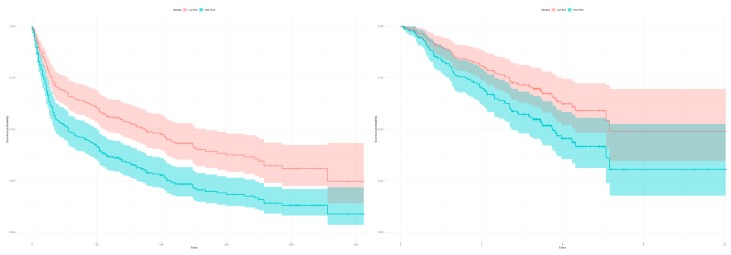
Figure 6.
Kaplan-Meier estimators with computed 95% confidence interval to evaluate the patient classification in high and low risk groups deploying the 22 gene signature on two independent datasets. The classification in high and low risk groups is based on the expression profiles between tumor and healthy samples of the merged datasets (GSE18842, GSE19804). (Left) The plot shows a classification in high and low risk groups for the 293 patients from the validation dataset GSE30219 based on the 22 survival correlated genes (p-value = 0.0002166; low risk: 121 samples, high risk: 172 samples, number of events/deaths: 188). (Right) The 22 gene signature can classify the 181 patients in the validation dataset GSE50081 in high and low risk groups (p-value = 0.02919; low risk: 88 samples, high risk: 93 samples, number of events/deaths: 75).

