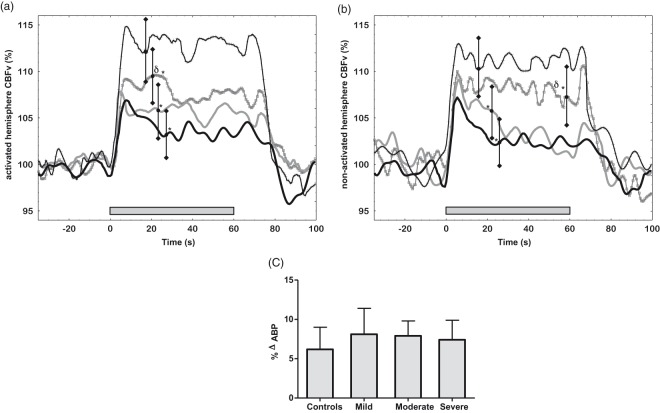
Figure 2.
Cerebral and systemic hemodynamic responses to the passive paradigm (grey bar). (a) CBFv responses in the activated hemisphere of control (continuous black line + crosses), mild stroke (continuous grey line + squares), moderate stroke (continuous grey line) and severe stroke (continuous black line); (b) CBFv percentage responses in the non-activated cerebral hemispheres; (c) Variation in BP during the paradigm performance. Bars represent one SD. δ p < 0.006 between mild and the other two stroke groups *p < 0.05 between stroke and control.

