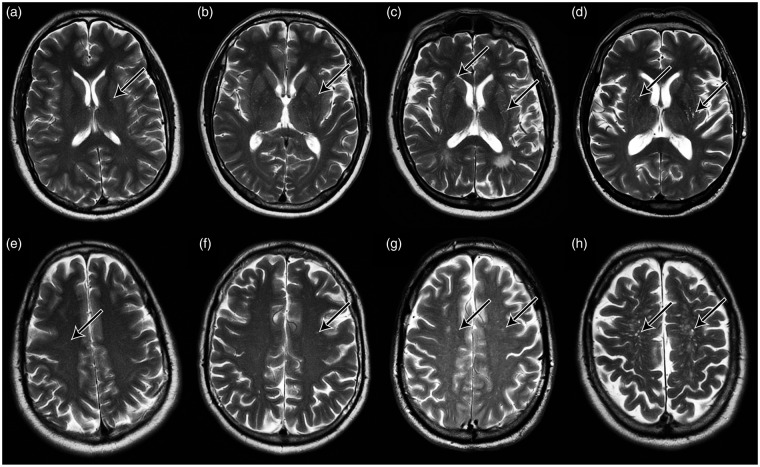
Figure 2.
Representative MR images of ePVS burden across severity categories. Panels (a) to (d) show axial T2 MR brain images acquired at 3T at the level of the basal ganglia. Panels (e) to (h) show axial T2 MR brain images acquired at 3T at the level of the centrum semiovale. Arrows denote individual ePVS. Columns are ordered left to right in increasing bins of ePVS burden (1–10, 11–20, 21–40, 41+).

