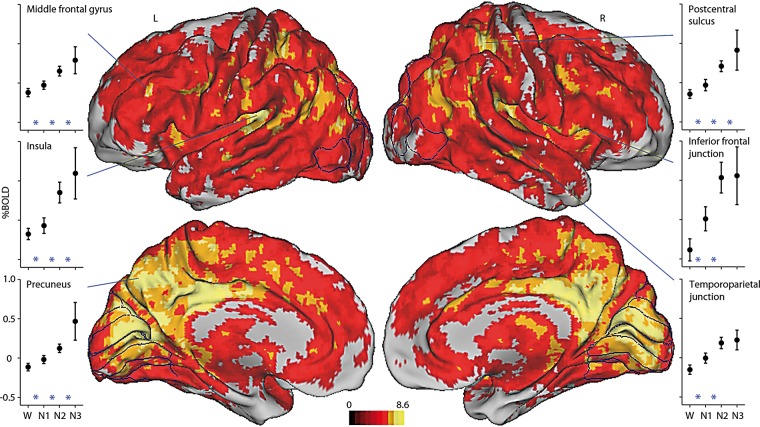
Figure 2.
The mean global signal increases with sleep depth. Direct statistical comparison of the mean global signal over the four non-REM sleep stages. Shown is the main effect of sleep stage from a group level linear mixed effects analysis of 71 subjects. Displayed regions exhibit significant mean global signal changes across W, N1, N2, and N3 sleep. Color bar reflects the value of gaussianized F statistics corrected for multiple comparisons (P < 0.05). Lateral surfaces are displayed in the first row and medial surfaces in the second row. Highlighted regions include the middle frontal gyrus, insula, and precuneus in the left hemisphere, and postcentral sulcus, inferior frontal junction, and temporoparietal junction in the right hemisphere. Plotted are group averaged mean global signals for W (71 subjects), N1 sleep (58 subjects), N2 sleep (42 subjects), and N3 sleep (19 subjects). Percent BOLD signal was computed for each subject by normalizing to the value of the constant term, then multiplying by 100. Error bars reflect the 95% confidence interval of the means. Included in the plots are three regional post hoc, group-level linear mixed effects analyses: W vs. N1 (71 subjects), N1 vs. N2 (58 subjects), and N2 vs. N3 (42 subjects), with * indicating P < 0.05 for the two stages it is placed between.

