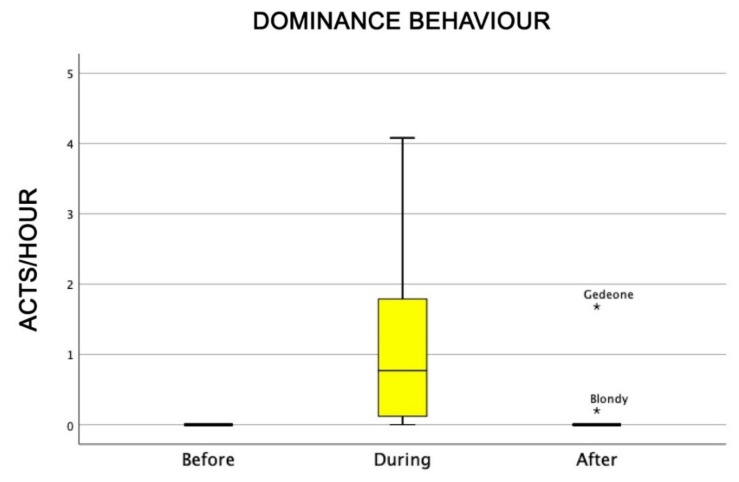
Figure 2.
Behavioural patterns related to dogs’ dominance behaviour before, during, and after AAI sessions. Non-parametric data are represented as medians (horizontal bar in the box) and the box indicates the interquartile range of 50% of the data. Whiskers extend to the smallest and largest values and exclude outliers (dot on top).

