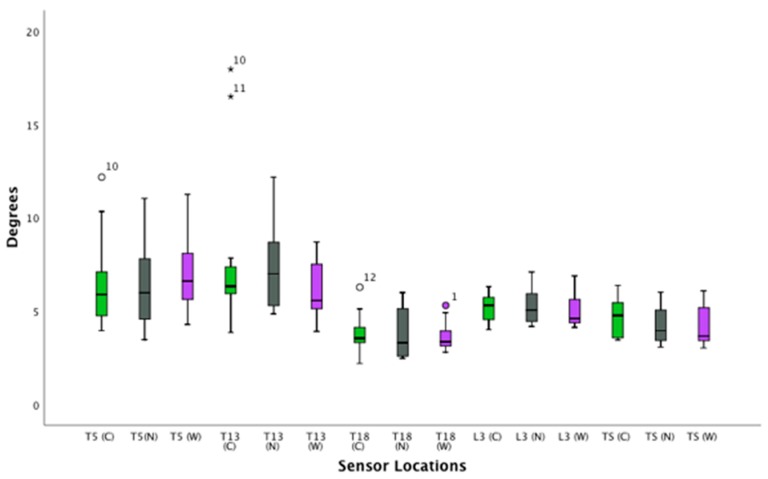
Figure 4.
Flexion and extension of the thoracolumbar spine in trot. Boxplots displaying flexion-extension of the thoracolumbar spine in thirteen horses while trotting for the three saddle conditions: correct saddle (green), narrow saddle (grey), and wide saddle (purple). The central line represents the median; the box represents the 25th and 75th percentiles; and the whiskers represent the maxima and minima not considered to be outliers. ⚬ represents outliers and * represents extreme outliers. Post hoc analysis showed an increase in flexion-extension at T13 between the correct and narrow saddle widths (4%, p = 0.04).

