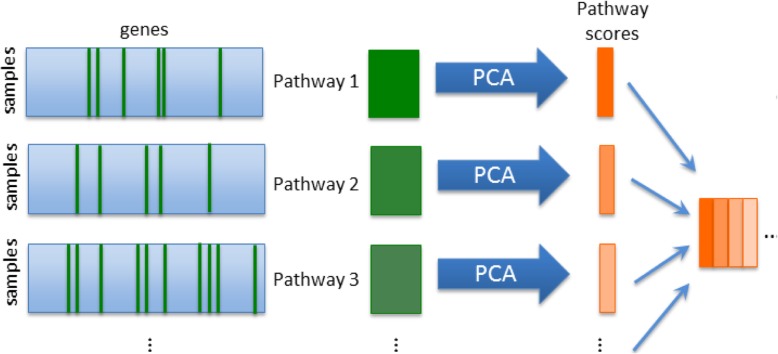
Fig. 1.
Workflow designed to produce a pathway space representation of a gene expression data set. The expression values for all qi genes in the i’th pathway (green columns) are extracted from the original (nxm) expression matrix to form a new (nxqi) matrix. PCA is performed on this matrix and the score on the first component retained as the pathway score. This is repeated for each of the k pathways and the pathway scores assembled into a new ‘pathway space’ matrix of dimension (nxk) (orange)

