Fig. 7.

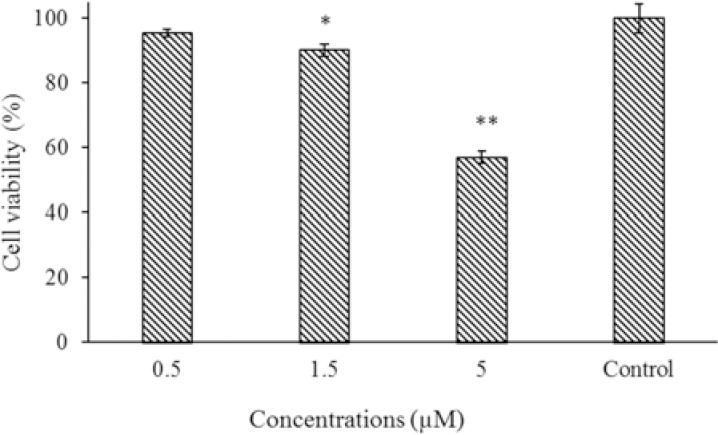
The effect of different concentrations of empty niosomes on viability of HepG2 cells. Data are presented as mean ± SD. * P < 0.05 and ** P < 0.01 indicate significant differences compared to the control group.

The effect of different concentrations of empty niosomes on viability of HepG2 cells. Data are presented as mean ± SD. * P < 0.05 and ** P < 0.01 indicate significant differences compared to the control group.