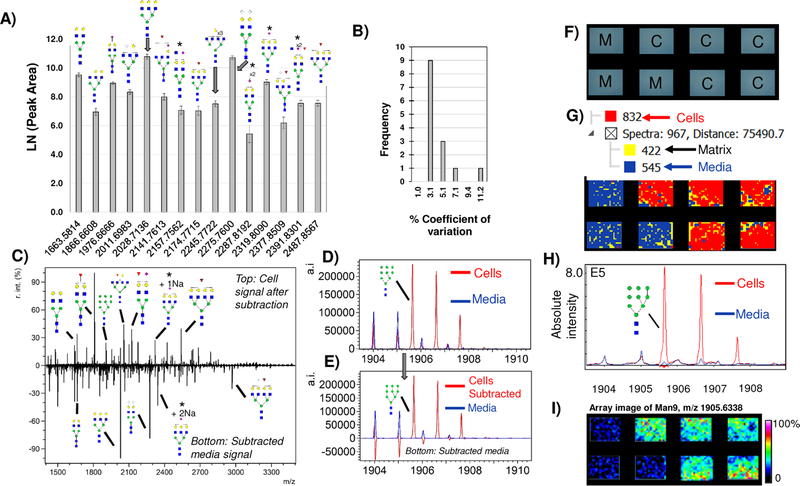
Figure 2.
Media contribution of N-glycans. A) Major peaks with putative N-glycoform structures detected in HAEC media blanks, illustrating the need to account for background N-glycans due to media when measuring cellular profiles of N-glycans. B) Media measurements are reproducible with 3.1% coefficient of variation. This allows media to be accounted for as a background measurement in cells grown with serum. C) Example background subtraction with major peaks annotated by putative N-glycoform structure. Top half of the spectrum is cells only; bottom half is media only. Subtracted media spectrum contains peaks that are NeuGc only (Hex4HexNAc5NeuGc1 + 1Na and Hex5HexNAc4NeuGc2 + 1Na). D-E) Example evaluation of media subtraction. (D) shows original overlap in spectra from media (blue) and cells (Red). E) Subtraction of media from cells retains Man9 intensity values while minimizing media contributions (bottom half of spectrum). F-I) A second approach to accounting for media contributions uses the image data to determine media contribution based on spatially oriented hierarchical clustering, shown on 4T1 mouse breast tumor cells. E) Schematic of array layout, M= media blank, C= cells. F) Hierarchical clustering of image spectra. Spectra are clustered based on localization to chamber and intensity. Each hierarchical cluster region is colorized for visualization showing cells as red, media as blue and MALDI matrix as yellow. G) Man9 signal from hierarchical cluster correlating to cells only (red) overlaid with media hierarchical cluster (blue). H) Man9 viewed as a heatmap image array. * = isobaric masses from N-glycan configurations that could contain either Neu5Ac and/or NeuGc. r.int. - relative intensity; a.i. – absolute intensity.

