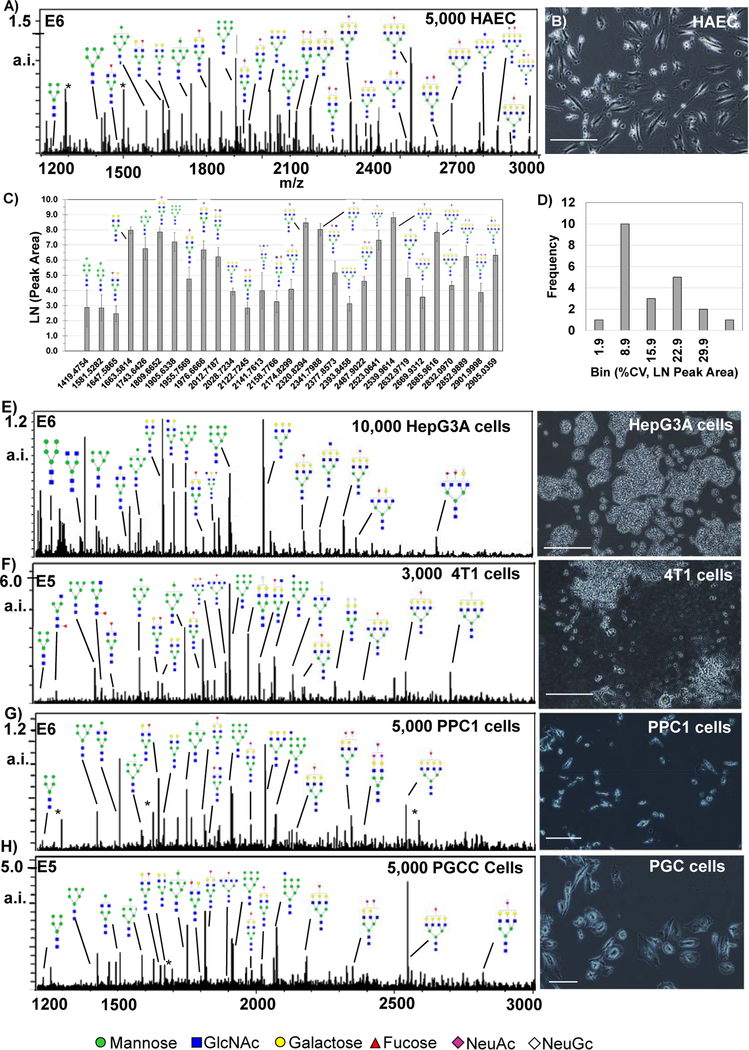
Figure 4.
N-glycan profiles from cells in culture. Major N-glycan peaks are annotated by putative structure. Cells were grown at normal confluency levels prior to N-glycoform profiling experiments and intensity levels vary per cell type. A) Human aortic endothelial cells (HAEC) showing N-glycan profiles by peak intensity. B) Photomicrograph of HAEC showing cell confluency at ~65%. C) Label free quantification of HAEC by peak area, n=8. D) Reproducibility of HAEC was mostly <10% CV. E-F, major N-glycoforms from different cell lines with examples of cell morphology to the right of N-glycan profiles. E) HepC3A cells grown in animal free serum. F) mouse 4T1 animal stage IV human breast cancer. G) PPC-1 cells demonstrating signal detection from small parental cells with low cell density. H) PGCC derived from PPC1 cells by radiation stress. * = matrix peak. a.i. – absolute intensity.

