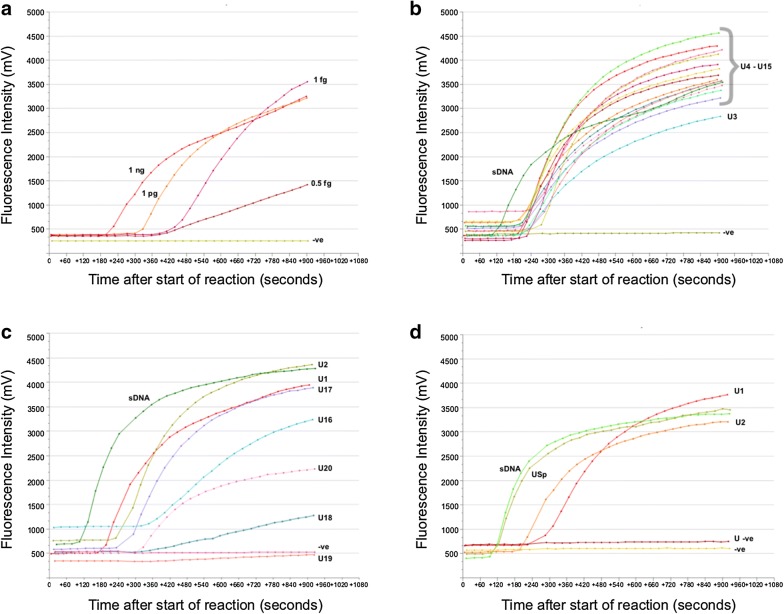
Fig. 2.
RPA fluorescent curves for the S. haematobium gDNA dilutions and the urine samples tested from PHL-IDC, Pemba. a S. haematobium gDNA dilutions. b Urine samples U3-15. c Urine samples U1+2 (high egg counts) and U16-20 (very low egg counts). d Urine samples U1+2 (high egg counts) and negative donor urine (U-ve) and negative donor urine spiked with S. haematobium gDNA (USp). sDNA corresponds to a DNA standard positive control. −ve corresponds to negative controls

