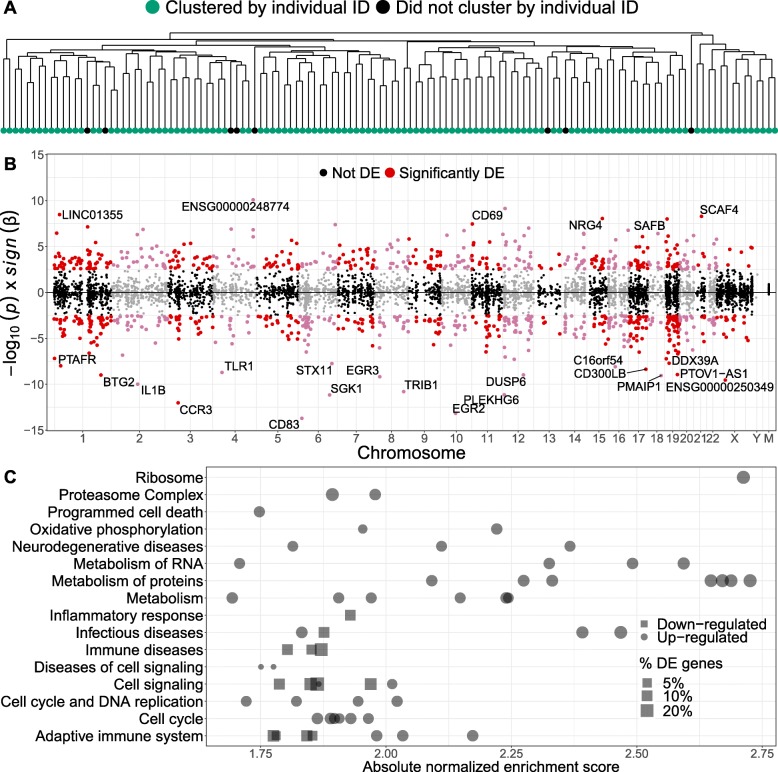
Fig. 1.
Population-level age-specific expression across the transcriptome. a Dendrogram of expression-based sample-to-sample distance. Measurements of the same individual at the two ages cluster together (green) for 93% of samples. b Mirror Manhattan plot of the expression-age discoveries. We find 1291 age-associated genes (8% of tested genes; FDR ≤5%). Each dot represents a gene; the x-axis gives the position of the gene in the genome, and the y-axis represents the direction of the age effect and the strength of the association. c Gene-set enrichment analysis of genes with age-specific expression. We observe strong enrichment for multiple age-related pathways. Each point represents a pathway; the x-axis gives the absolute enrichment score, which reflects the degree to which each pathway is overrepresented at the top or bottom of the ranked list of differentially expressed genes, normalized to account for differences in gene set size and in correlations between gene sets and the expression data set. The y-axis lists the parent node of the most enriched pathways (FDR ≤5%). The names of each significant pathway are listed in Additional file 3

