Fig. 2.
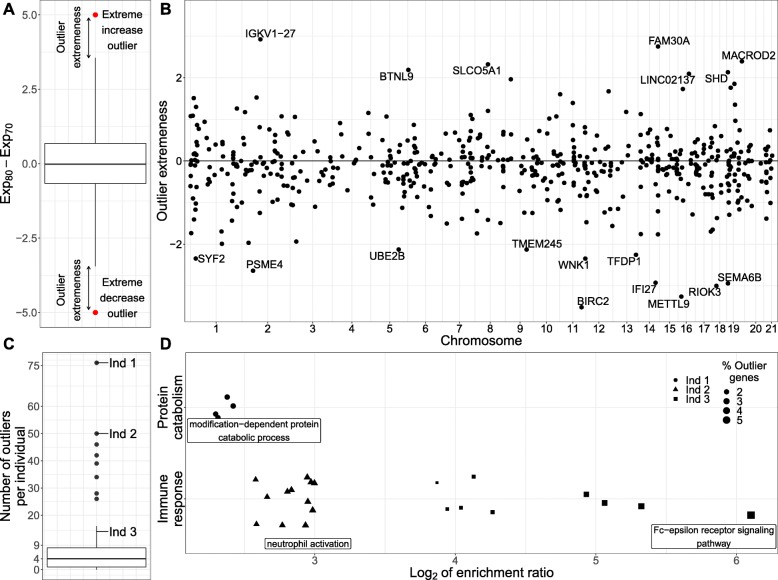
Individual-level age-specific expression across the transcriptome. a Illustration of age-trajectory outliers. Individuals are outliers for a gene if their change in the expression of the gene between the two ages falls outside the (Q1−3×IQR, Q3+3×IQR) range, where Q1 and Q3 are the 25th and 75th percentiles and IQR is the interquartile range. b Mirror Manhattan plot of the age-trajectory outliers. We find 555 individual-gene outlier pairs, consisting of 529 individual genes, 60% of which show extreme expression decrease with age (outlier extremeness < 0). IGKV1-27, responsible for antigen binding and involved in adaptive immune response, shows the largest expression increase. BIRC2, an apoptosis-inhibitor gene, shows the largest expression decrease. Each dot represents a gene; the x-axis gives the position of the gene in the genome, and the y-axis represents the outlier extremeness (illustrated in a). c Number of outlier genes for each individual. The median number of outlier genes per individual was 4 with 14% of individuals showing no outliers while 13% had more than 20 outlier genes. d Enrichment for Gene Ontology biological processes for outlier genes of each individual. We observed significant enrichment (FDR ≤5%) for specific terms for the outlier genes of three individuals. For two of these individuals, we see enrichment for terms related to immune response. For the third individual, we see enrichment for terms related to protein catabolism

