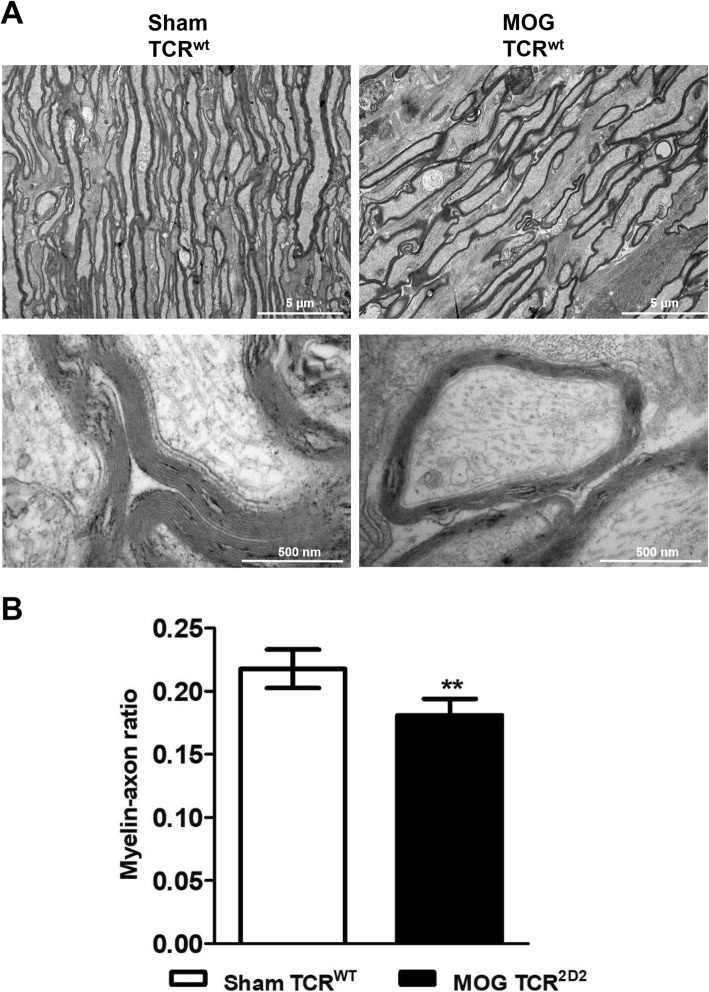
Fig. 4.
a Electron microscopy images of longitudinal sections of the optic nerve fibers from sham- and MOG35–55-treated C57Bl/6J wild-type mice. b The myelin-axon ratio was determined by the thickness of the myelin sheath and the axon. Bar graphs represent the pooled mean ± SD of an EAE experiment with four animals per group; **P < 0.01 two-tailed Student’s t test compared to sham-treated mice

