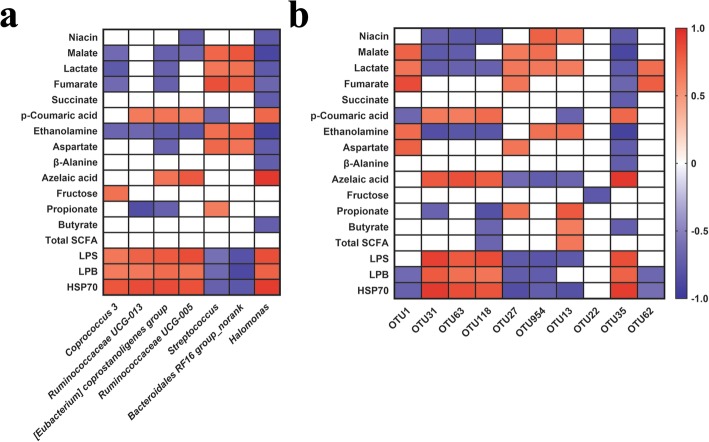
Fig. 5.
Effects of late gestational HS on correlation analysis between fecal bacteria (genus and OTU levels) and metabolite profiles (P < 0.05, VIP > 1). a Genus level. b OTUs level. The cells are colored based on the Spearman’s correlation coefficient between the significantly changed bacteria (relative abundance) and metabolites. Red represents significant positive correlation (P < 0.05), blue represents significantly negative correlation (P < 0.05), and white represents that the correlation was not significant (P > 0.05)

