Figure 7.
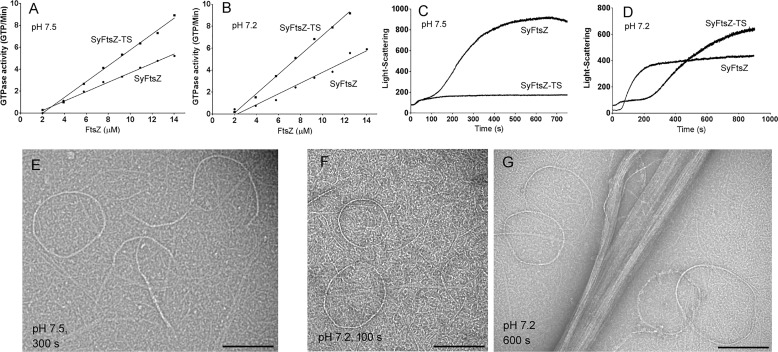
Comparison of assembly properties of WT SyFtsZ and SyFtsZ-TS (SyFtsZ-A271T/A274S). A and B, the double mutant increased the GTPase somewhat at both pH 7.5 (A) and pH 7.2 (B). C, light scattering suggests that the SyFtsZ-TS at pH 7.5 assembled only to the first stage and was missing the large rise in turbidity attributed to the second stage (cf. Fig. 2). D, at pH 7.2, the first stage of assembly was prolonged, but the second stage rise in turbidity began at ∼300 s. E–G, EM confirms that SyFtsZ-TS only assembles into single straight pfs and thin curved bundles at pH 7.5, 300 s (E) and at pH 7.2, 100 s (F). These assemblies are characteristic of stage 1 (see Fig. 2). At pH 7.2, 600-s large thick bundles characteristic of stage 2 are seen (G). Bar, 200 nm. All buffers contained 50 mm HEPES, 100 mm KAc, 5 mm MgAc, and 0.5 mm GTP.

